Bitcoin Price Bounce Weakens, Recovery at Risk of Fading Again
Bitcoin price started a recovery wave from $68,000. BTC is now back above $70,000 and might struggle to continue higher in the near term. Bitcoin started a decent recovery wave above $69,500 and $70,000. The price is trading above...
 Troov
Troov

Bitcoin price started a recovery wave from $68,000. BTC is now back above $70,000 and might struggle to continue higher in the near term.
Bitcoin started a decent recovery wave above $69,500 and $70,000. The price is trading above $70,000 and the 100 hourly simple moving average. There was a break above a bearish trend line with resistance at $69,500 on the hourly chart of the BTC/USD pair (data feed from Kraken). The pair might start another decline if it stays below the $71,500 and $72,000 levels.Bitcoin Price Attempts Recovery
Bitcoin price found support near the $67,500 zone and recently started a recovery wave. BTC climbed above the $68,800 and $69,500 resistance levels.
There was a break above a bearish trend line with resistance at $69,500 on the hourly chart of the BTC/USD pair. The bulls were able to push the price above the 38.2% Fib retracement level of the downward move from the $75,999 swing high to the $67,343 low.
However, the price faced resistance near the $71,500 zone and the 50% Fib retracement level of the downward move from the $75,999 swing high to the $67,343 low. Bitcoin is now trading above $70,000 and the 100 hourly simple moving average.
If the price remains stable above $70,000, it could attempt a fresh increase. Immediate resistance is near the $71,650 level. The first key resistance is near the $72,000 level. A close above the $72,000 resistance might send the price further higher.
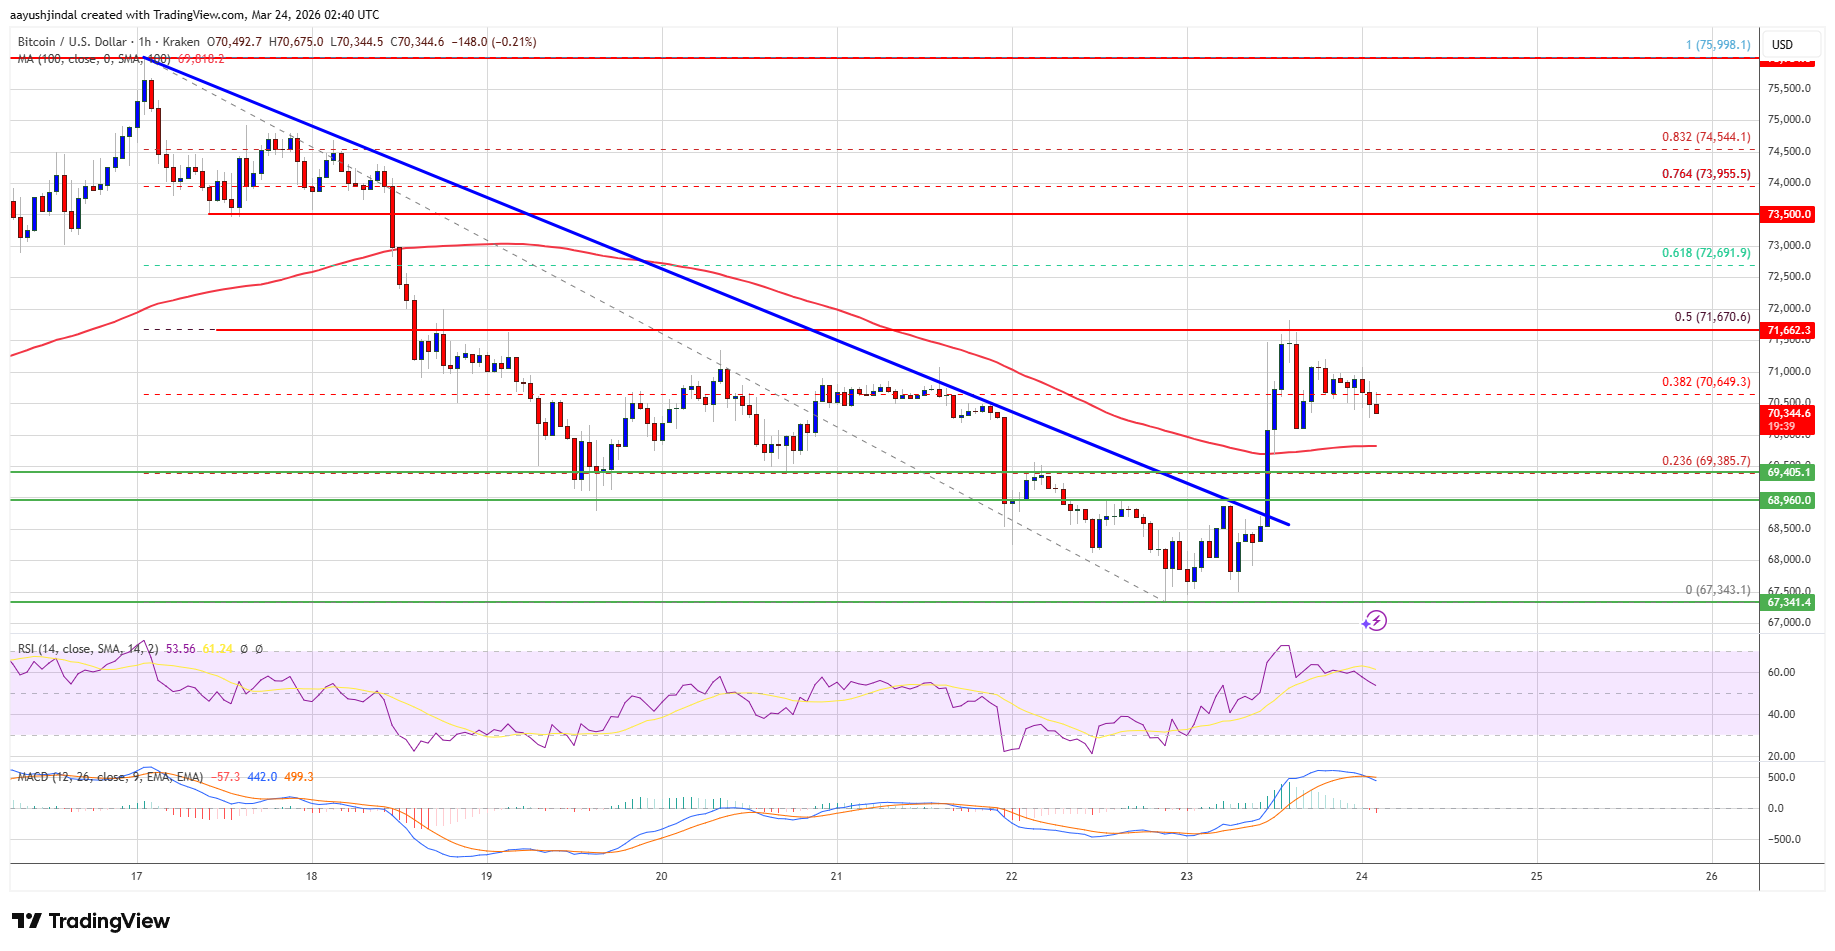 Source: BTCUSD on TradingView.com
In the stated case, the price could rise and test the $73,500 resistance. Any more gains might send the price toward the $74,200 level. The next barrier for the bulls could be $75,000.
Another Decline In BTC?
If Bitcoin fails to rise above the $71,650 resistance zone, it could start another decline. Immediate support is near the $70,000 level. The first major support is near the $69,350 level.
The next support is now near the $68,950 zone. Any more losses might send the price toward the $68,000 support in the near term. The main support now sits at $67,500, below which BTC might struggle to recover in the near term.
Technical indicators:
Hourly MACD – The MACD is now losing pace in the bullish zone.
Hourly RSI (Relative Strength Index) – The RSI for BTC/USD is now above the 50 level.
Major Support Levels – $68,950, followed by $68,000.
Major Resistance Levels – $71,650 and $72,000.


.jpeg?width=1200&height=800&crop=1200:800)