Bitcoin Rally Ahead? DXY Breakdown Suggests Capital Shift To Risk-On Assets
The US national debt recently hit a new all-time high (ATH), surging above $36.5 trillion and putting significant pressure on the US Dollar Index (DXY). As the DXY struggles under the weight of mounting debt, crypto analysts believe capital...
 Troov
Troov

The US national debt recently hit a new all-time high (ATH), surging above $36.5 trillion and putting significant pressure on the US Dollar Index (DXY). As the DXY struggles under the weight of mounting debt, crypto analysts believe capital may soon shift to risk-on assets like Bitcoin (BTC).
DXY Breakdown Suggests Bitcoin Rally
According to a recent CryptoQuant Quicktake post by contributor Darkfost, the DXY has dropped to a historically weak level, currently trading 6.5 points below its 200-day moving average (MA) – the largest deviation in the past 21 years.
For the uninitiated, the DXY measures the value of the US dollar relative to a basket of six major foreign currencies, including the euro, yen, pound, Canadian dollar, Swedish krona, and Swiss franc. It is widely used as an indicator of USD strength or weakness and often influences investor sentiment across global financial markets.
While a breakdown in the DXY might seem alarming at first, it historically benefits risk-on assets like BTC. A weakening dollar typically precedes capital rotation into alternative asset classes.
Following that logic, the recent softness in the USD could prompt investors to reassess their portfolios – potentially increasing allocation to digital assets. Darkfost illustrated this point with the below chart.
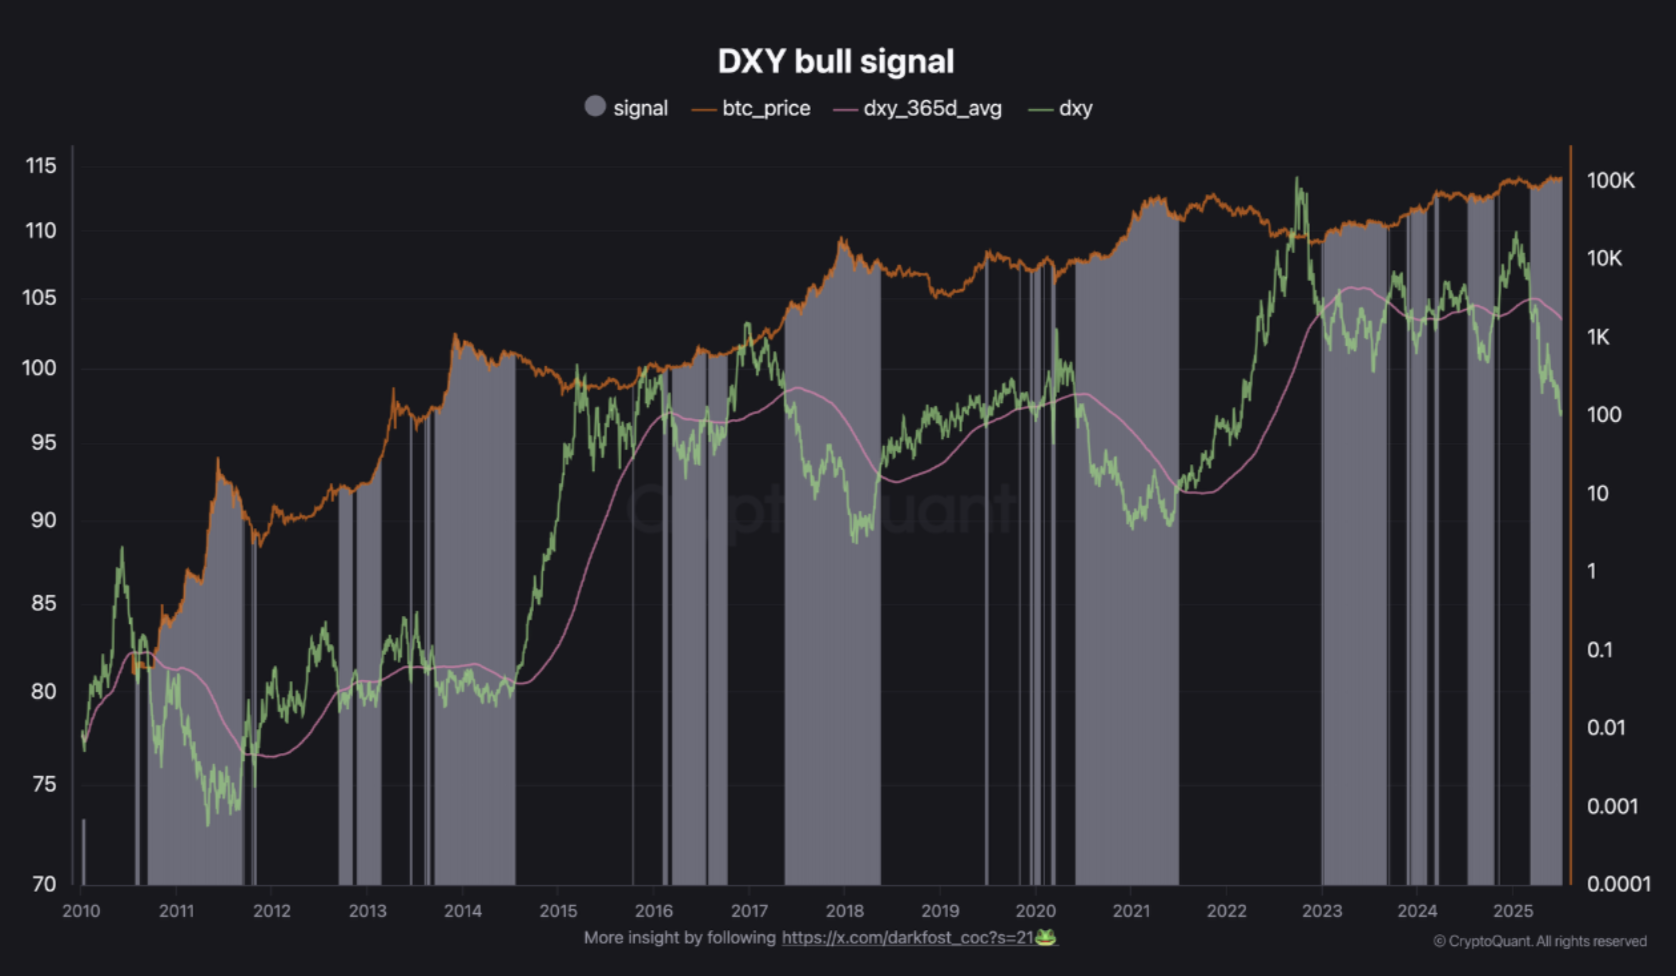 Source: CryptoQuant
The chart highlights periods where the DXY traded below its 365-day MA. Historically, these phases have aligned with strong BTC price appreciation. The analyst added:
We are currently in a phase where the weakness of the DXY could fuel a new rise in BTC but the price didn’t reacted yet. This tool serves as a valuable indicator for identifying early bull market phases and periods of euphoria, not because of pure technical triggers, but because it reflects increasing liquidity potentially flowing into crypto markets.
According to data from CoingGecko, BTC is currently trading just about 2.2% below its ATH of $111,814 recorded on May 22. With BTC decisively breaking through a bullish flag, the flagship cryptocurrency looks set to hit a new ATH in the near-term.
Some Warning Signs To Watch Out For
Despite a favorable macro backdrop, several warning signs could dampen BTC’s bullish momentum. For instance, Bitcoin’s Apparent Demand metric has recently turned negative.
Similarly, some on-chain metrics suggest that the BTC rally may be running out of steam. Bitcoin’s NVT Golden Cross recently showed signs of a potential local top.
That said, Bitcoin continues to show resilience, absorbing persistent selling pressure in the derivatives market and avoiding a breakdown below the $100,000 mark. At press time, BTC trades at $109,520, up 0.7% over the past 24 hours.
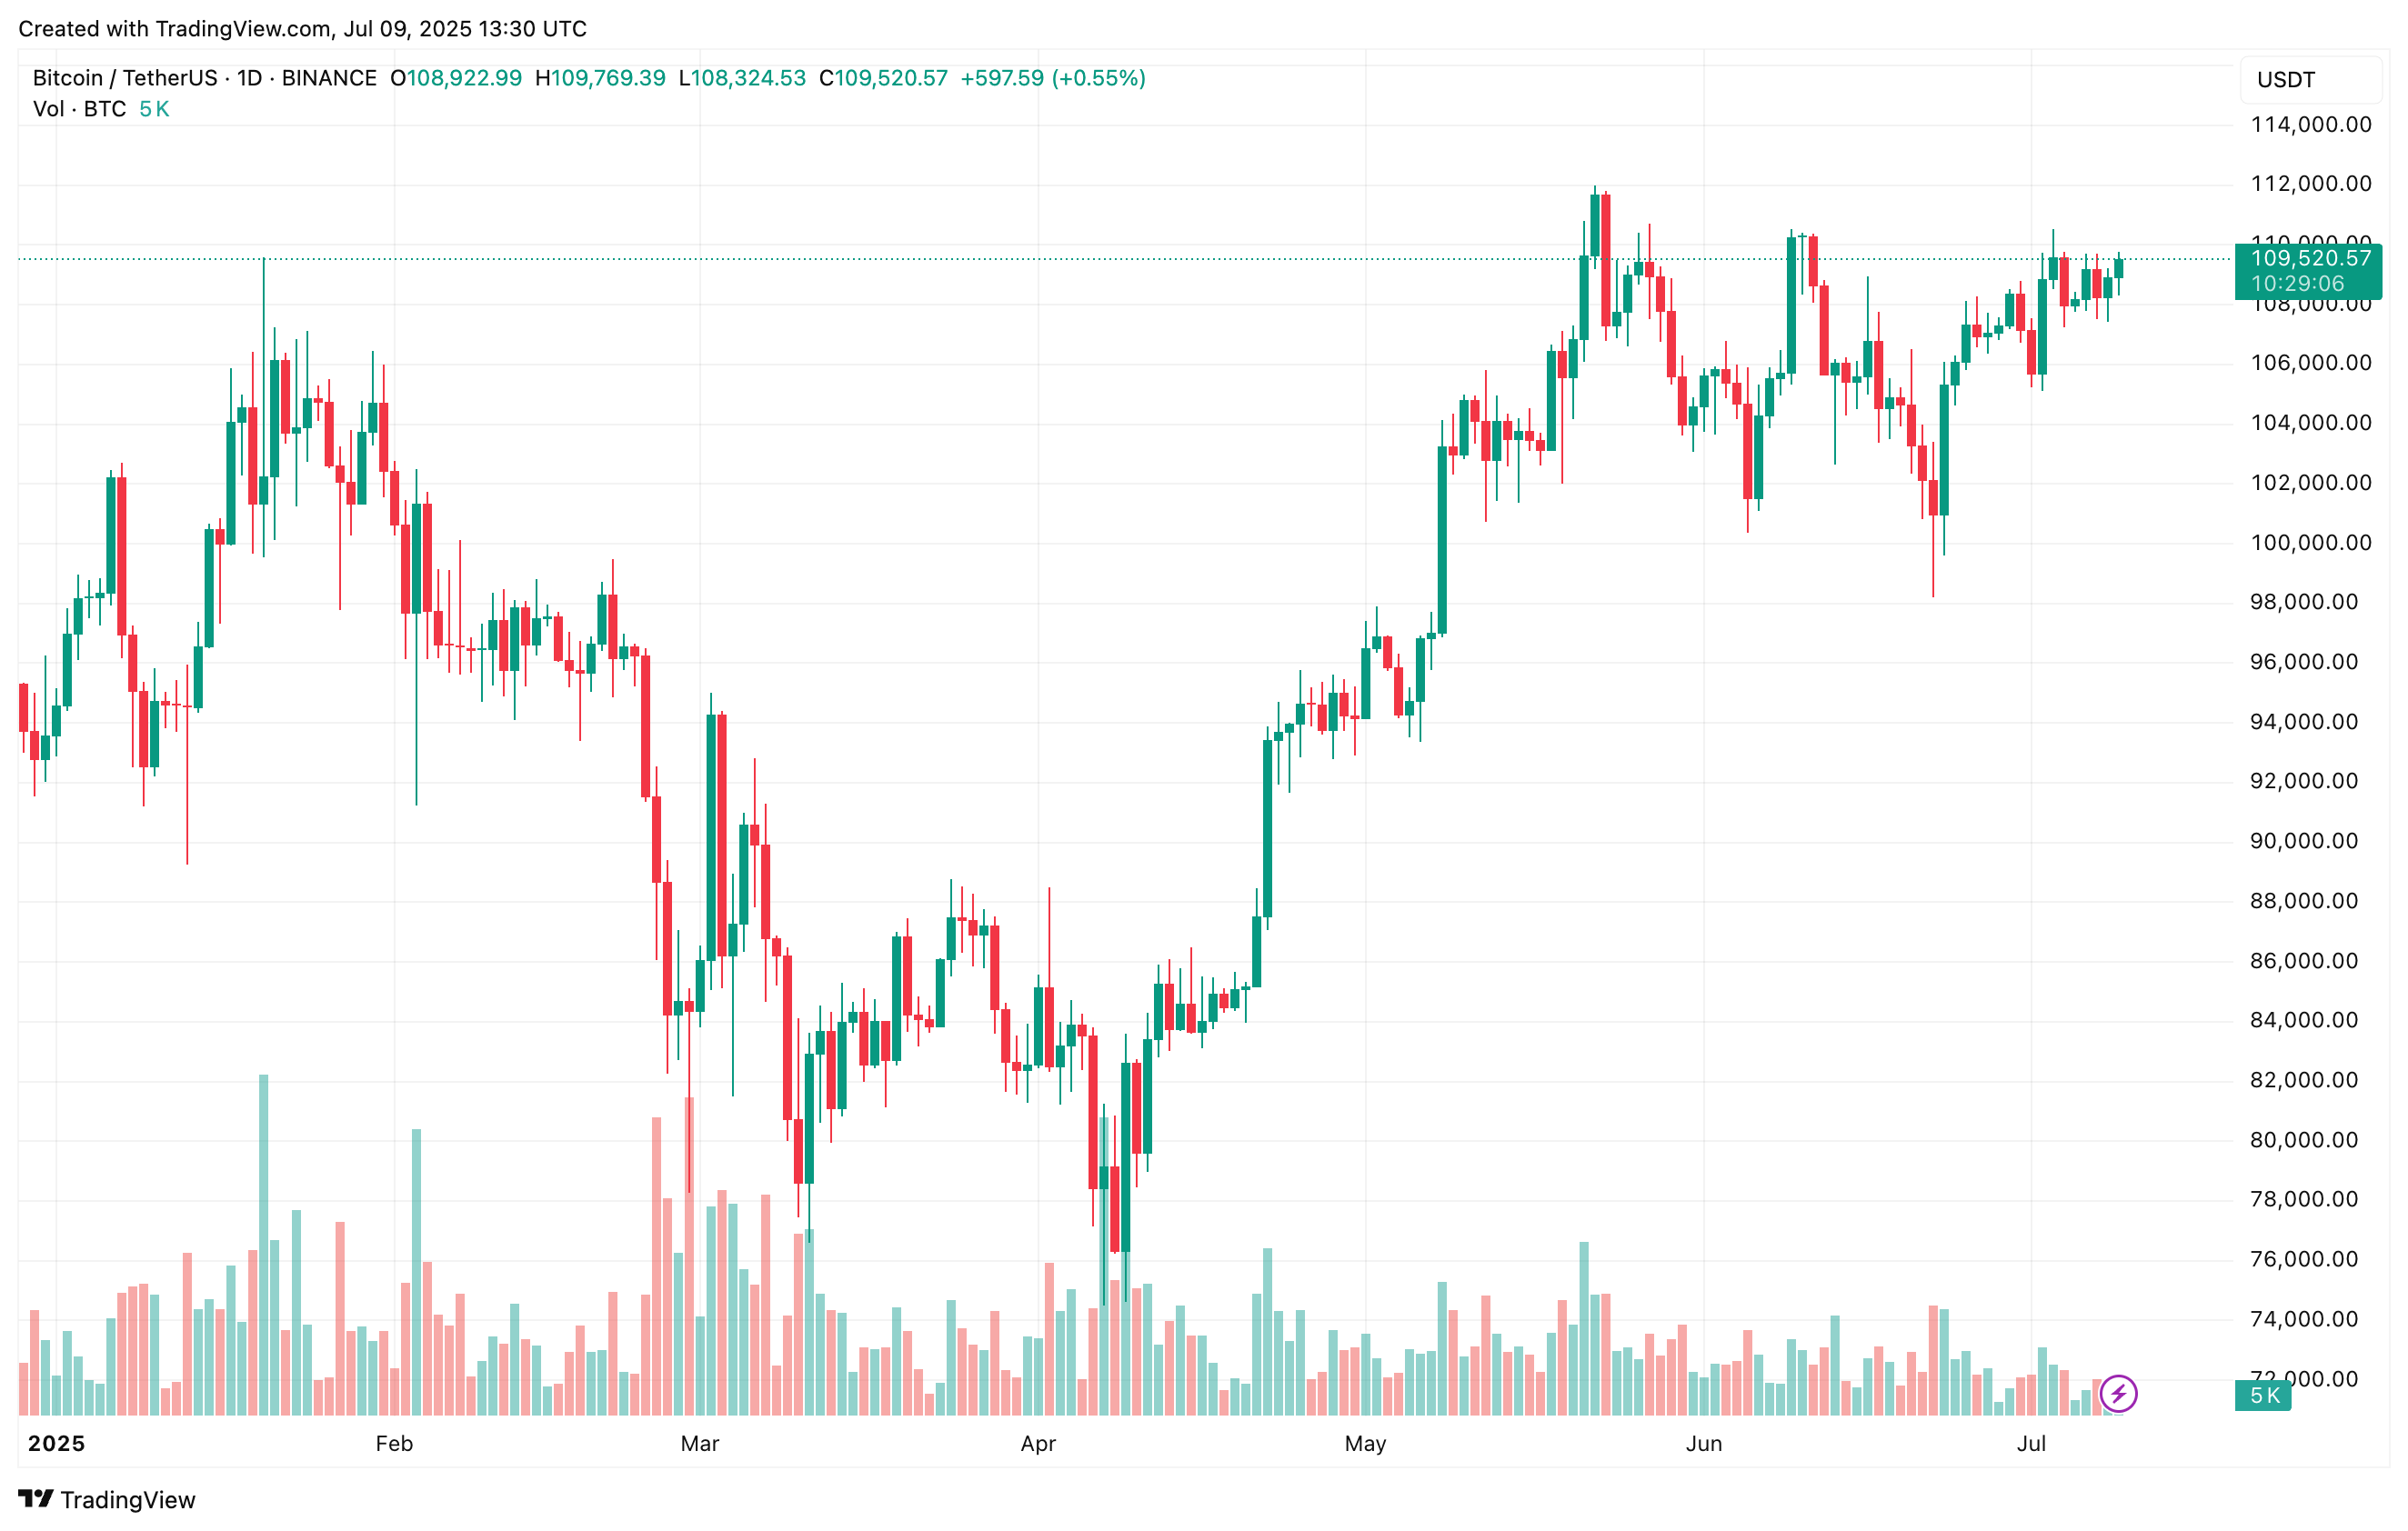 Bitcoin trades at $109,520 on the daily chart | Source: BTCUSDT on TradingView.com
Featured image from Unsplash, charts from CryptoQuant and TradingView.com


/cdn.vox-cdn.com/uploads/chorus_asset/file/25825493/VST_011025_Site.jpg)