Dogecoin Charts Textbook Cup And Handle: Macro Target Stuns At $2.31
Dogecoin’s weekly chart is flashing one of technical analysis’ most recognizable continuation structures, with crypto analyst badger (@badger0102) mapping a potential macro cup-and-handle that spans the entire 2021–2025 cycle and projects upside far beyond prior peaks. “DOGE 1W –...
 Tfoso
Tfoso
Dogecoin’s weekly chart is flashing one of technical analysis’ most recognizable continuation structures, with crypto analyst badger (@badger0102) mapping a potential macro cup-and-handle that spans the entire 2021–2025 cycle and projects upside far beyond prior peaks. “DOGE 1W – Potential macro cup and handle forming,” the trader wrote alongside a TradingView screenshot of DOGE/USD (Binance). At the time of the chart, price printed around $0.2268, sitting squarely between the 0.50 and 0.618 Fibonacci retracements of the measured move.
Dogecoin Cup And Handle Signals Explosive Potential
The “cup” portion traces a multi-year basing arc from the euphoric 2021 blow-off through a prolonged decline into the 2022–2023 trough and a rounded recovery that accelerated in 2024. That left rim is defined by the 2021 distribution area and a dashed, falling trendline that guided price lower until being conclusively broken during the 2024 advance.
The low of the base aligns with the 0.00 Fibonacci anchor near $0.0491, while the right rim formed during the Q1–Q2 2025 thrust that stalled just beneath the 0.786 retracement at ~$0.4181 and ahead of the 0.886 at ~$0.5490, marking the structural “lip” of the cup.
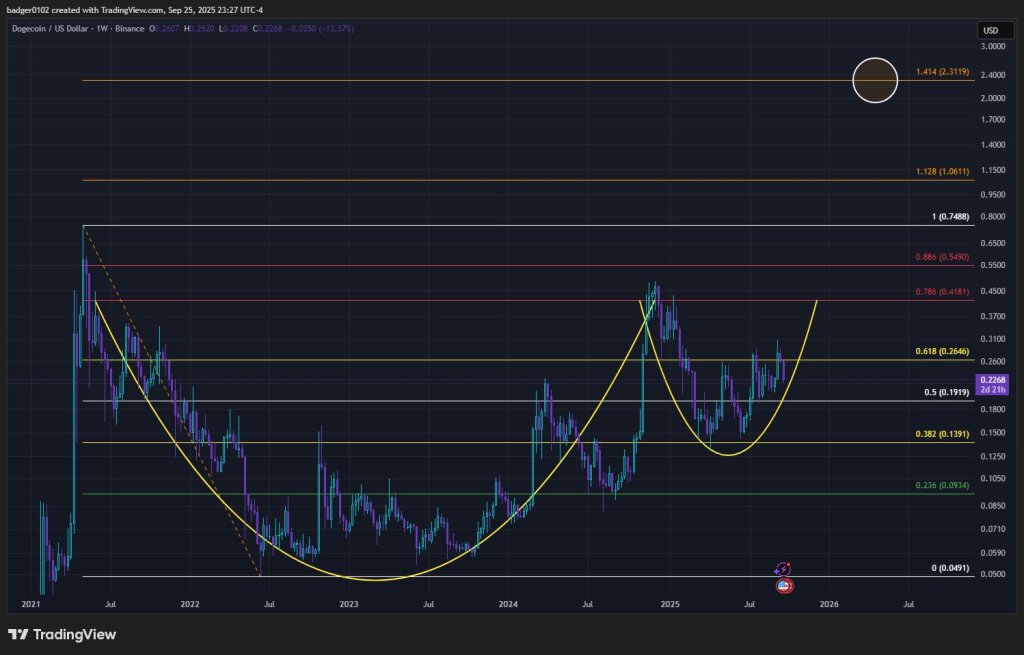 Dogecoin cup and handle pattern, monthly chart | Source: X @badger0102
Following that surge, DOGE carved a classic “handle” pullback into mid-2025, bottoming in the $0.14 region—neatly bracketing the 0.382 retracement at ~$0.1391—before pivoting higher. The rebound has since reclaimed the 0.50 at ~$0.1919 and is pressing toward the 0.618 at ~$0.2646, the first key level bulls must clear to maintain the handle’s constructive geometry. As drawn, the handle’s depth remains proportionate (approximately a 38–50% retrace of the right-rim advance), preserving the pattern’s validity on a weekly timeframe.
The chart lays out an orderly ladder of resistances and targets should momentum persist. Above $0.2646 (0.618), the structure’s neckline/rim zone emerges between the mid-$0.30s and low-$0.40s, capped by the 0.786 at ~$0.4181.
A weekly close through that band would constitute the textbook cup-and-handle breakout and opens measured-move and extension objectives higher up the stack: 0.886 at ~$0.5490, the 1.000 extension near ~$0.7488, and the 1.128 at ~$1.0611. The chart’s focal marker is a highlighted circle at the **1.414 Fibonacci extension—approximately $2.3119—framed as the macro target if the pattern completes and trends extend.
On the downside, the handle’s structure provides a clear invalidation map. Immediate support rests at the 0.50 ($~0.1919), followed by $~0.1391 (0.382) and $~0.0934 (0.236). A sustained loss of the handle low in the mid-$0.15s would undercut the pattern, risking a return toward the deep-base band above $0.05 anchored at $0.0491.
Contextually, the multi-year rounding base underscores a significant shift from distribution to accumulation, evidenced by the break of the long dashed downtrend drawn from the 2021 high through 2022–2023. The right-side advance and orderly handle retracement fit the classic momentum-pause-continuation sequence technicians look for on higher-timeframe charts.
Confirmation, however, remains conditional on follow-through: bulls need to absorb supply into $0.26–$0.27, attack the $0.35–$0.42 rim, and then register a weekly breakout with expanding range to activate the upper Fibonacci targets.
At press time, DOGE traded at $0.225.
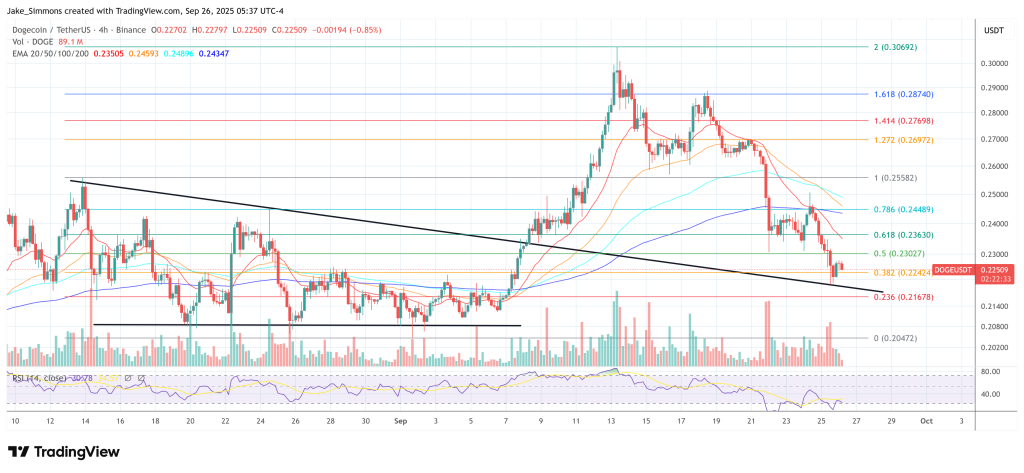 Dogecoin price, 4-hour chart | Source: DOGEUSDT on TradingView.com
Featured image created with DALL.E, chart from TradingView.com