Old Bitcoin Supply Keeps Moving Into ETFs: Data Shows Three Waves So far
On-chain data shows the Bitcoin spot exchange-traded funds (ETFs) have seen three waves of major inflows from the veteran hands in this cycle so far. Bitcoin Coin Days Destroyed Shot Up Alongside Earlier ETF Net Inflows As explained by...
 BigThink

On-chain data shows the Bitcoin spot exchange-traded funds (ETFs) have seen three waves of major inflows from the veteran hands in this cycle so far.
Bitcoin Coin Days Destroyed Shot Up Alongside Earlier ETF Net Inflows
As explained by CryptoQuant author Maartunn in a new post on X, Bitcoin has been observing major reshuffles related to old tokens and the spot ETFs. The spot ETFs refer to investment vehicles that trade on traditional platforms and allow investors to gain exposure to an underlying asset like BTC without having to directly own the asset.
The BTC spot ETFs launched in the US in January 2024. Since then, the funds have generally enjoyed growth, with a few periods involving a particularly sharp burst of inflows. The main attraction of the ETFs is that investors unfamiliar with the cryptocurrency world can invest into BTC in a form that’s convenient to them.
When a trader invests into such a vehicle, the fund buys an equivalent amount of the cryptocurrency on the client’s behalf. This reflects as an on-chain movement into the wallets associated with the ETF.
Below is the chart shared by Maartunn that shows the trend in the 30-day Bitcoin spot ETF netflow since the start of 2024.
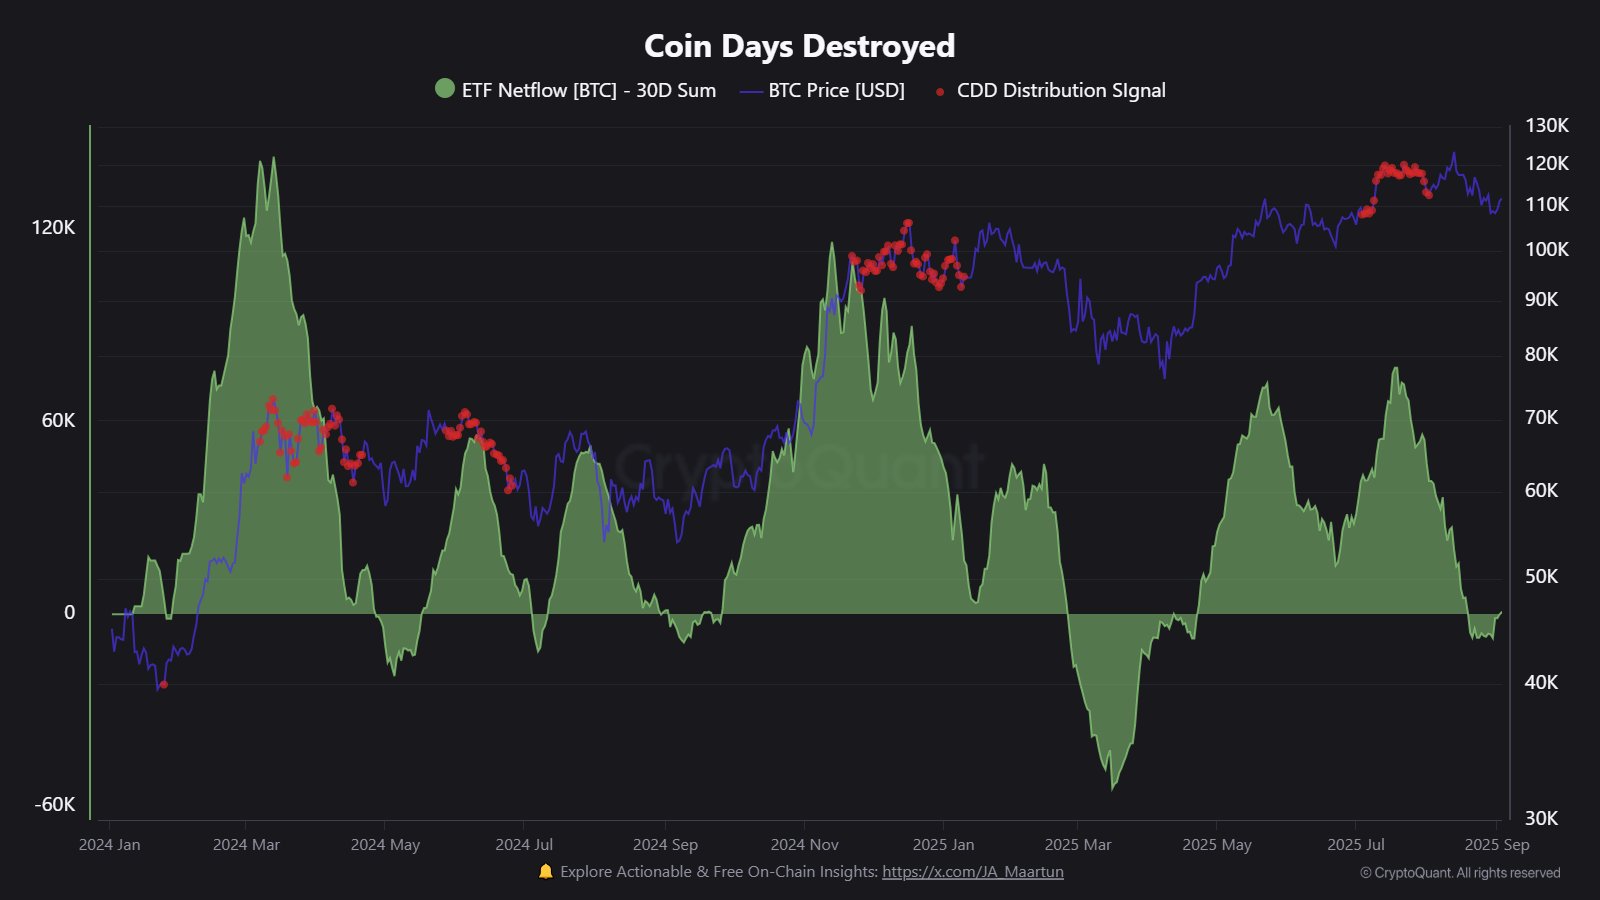 The value of the metric appears to be neutral at the moment | Source: @JA_Maartun on X
As displayed in the graph, the Bitcoin spot ETF netflow has seen a few phases of extremely positive values. These naturally correspond to a high amount of demand for the ETFs.
Interestingly, there is a pattern common among these large waves of inflows. From the chart, it’s visible that the Coin Days Destroyed (CDD) gave distribution signals alongside the netflow spikes.
The CDD is an on-chain indicator that measures the total number of coin days that are being “destroyed” in transactions across the BTC network. A coin day is a quantity that one BTC accumulates after staying dormant on the blockchain for one day. When a token dormant for some number days is moved, its coin days counter returns back to zero. The coin days that it had previously been carrying are said to be destroyed.
Generally, spikes in this metric correspond to activity from the diamond hands of the network. These HODLers tend to accumulate a massive amount of coin days with their patience, so when they finally break their silence, large-scale destruction of coin days takes places.
The three major Bitcoin ETF net inflow waves of Summer 2024, Fall 2024, and Summer 2025 all accompanied a distribution signal from the CDD, which suggests a rotation of coins happened from the veteran hands to new demand coming through these vehicles.
Since the latest such wave, the ETF netflow has calmed down to the neutral level, meaning demand has gone cold. “ETF inflows are key,” notes Maartunn. “Without strong new demand, selling pressure from new holders could increase.”
BTC Price
At the time of writing, Bitcoin is trading around $110,500, up 2% over the past week.
Featured image from Dall-E, CryptoQuant.com, chart from TradingView.com