This Litecoin Indicator Just Crossed A Critical Level — Here’s What Happened Last Time
The price of Litecoin has been one of the brightest spots in the altcoin market over the past few weeks, jumping by more than 30% so far in the month of July. The LTC price, however, barely made a...
 Astrong
The price of Litecoin has been one of the brightest spots in the altcoin market over the past few weeks, jumping by more than 30% so far in the month of July. The LTC price, however, barely made a dent over the past week, mirroring the sluggish state of the crypto market in recent days.
Nevertheless, the future still looks quite promising for Litecoin, with several analysts backing the cryptocurrency to embark on an extended rally over the next few months. In one such evaluation, a market expert on X has said that the price of LTC might be at the beginning of an upward rally.
LTC Price Soared 11,900% Last Time This Happened
In a July 26 post on the X platform, Chartered Market Technician (CMT) Tony Severino put forward an exciting prognosis for the price of Litecoin. According to the crypto expert, the altcoin appears on the verge of what might be a defining upward run in the coming months.
This projection is based on the recent movements of the Litecoin Average Directional Index (ADX) on the monthly timeframe. Average Directional Index is an indicator used in technical analysis to determine the strength of an asset’s price trend.
The ADX indicator evaluates the strength of a price trend by measuring the degree of directional movement. These calculations are based on a moving average of price range expansion and contraction within a given timeframe.
Typically, when the Average Directional Index is below 20, it implies that the market is consolidating or moving sideways. However, when ADX moves between 20 and 25, it signals that a trend might be forming for the asset. Meanwhile, when the ADX rises above 25, it confirms the formation of a strong trend.
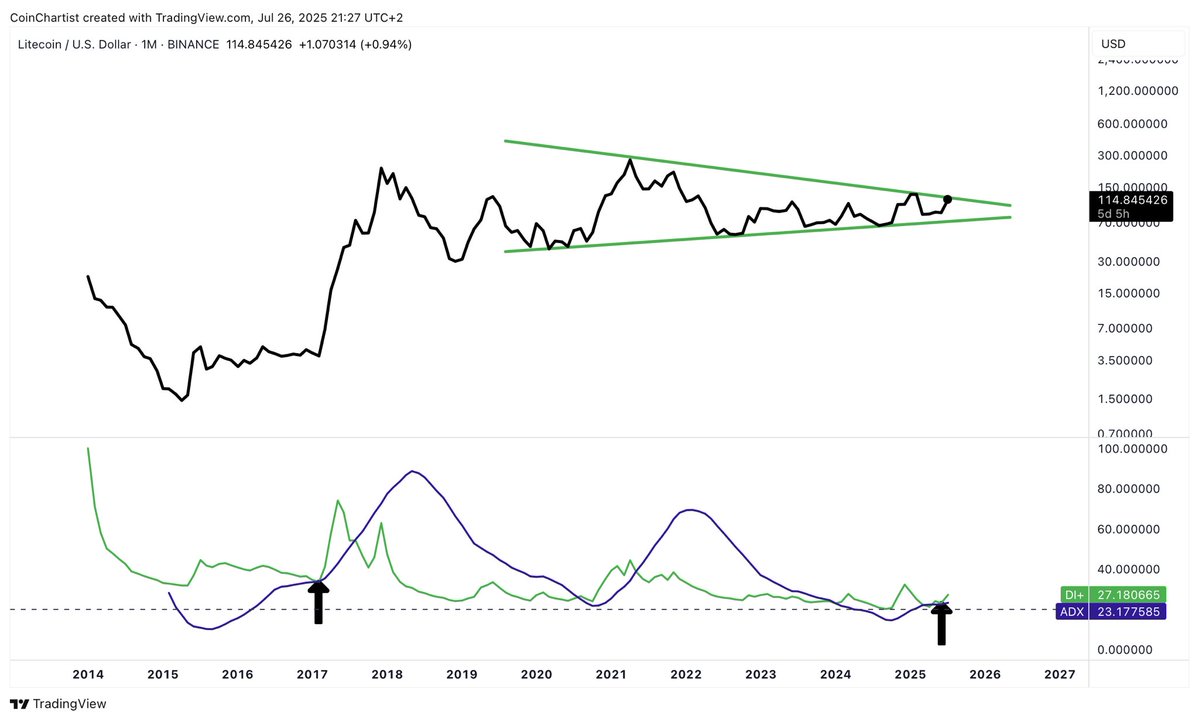 Source: @TonyTheBullCMT on X
Severino noted that the Average Directional Index on the Litecoin monthly timeframe is now above 20, meaning that a trend is forming. Meanwhile, the positive Directional Indicator (DI+) found a support cushion at the ADX line and is now rising.
This trend is similar to the one seen in 2017, where the ADX also crossed above the 20 mark and offered support to the DI+ (green line). This phenomenon was followed by a rally that saw the Litecoin price travel from around $3 to as high as $360 (an astounding 11,900% rally).
Hence, the price of Litecoin could confirm the start of a strong rally if the ADX keeps rising and eventually sustainably breaches the 25 threshold
Litecoin Price At A Glance
As of this writing, the price of LTC stands at around $114.61, reflecting an over 1% increase in the past 24 hours.
Featured image from PayPal, chart from TradingView


/cdn.vox-cdn.com/uploads/chorus_asset/file/23454340/DSCF7916.jpg)