
Average Organic Traffic Benchmarks From Real Websites (June 2026)
If I’m being honest: organic traffic benchmarks are a bit silly. The “right” number is unique to every business—your industry, your website, your Domain Rating, your strategy, all change what “normal” looks like. There’s no single average that fits...
 ShanonG
We pulled anonymized Google Search Console data from over 400,000 websites and measured how much organic search traffic a typical site actually gets each month. If I’m being honest: organic traffic benchmarks are a bit silly. The “right” number is unique to every business—your industry, your website, your Domain Rating, your strategy, all change what “normal” looks like. There’s no single average that fits everyone. But if you need a benchmark—because you, your boss, or your CEO wants to commit to a concrete growth target—the best place to look is the actual monthly organic traffic of websites in a similar spot to yours. That’s exactly what the data below gives you: real monthly organic traffic, grouped by industry, authority, and size. It’s real, it’s updated every month, and it’s your best starting point for gauging whether your own growth is on track. Below, we break down median monthly organic traffic by industry, by Domain Rating (DR), and by website size, then look at why the gap between small and large sites is so enormous. Methodology This article is updated monthly with fresh data by Agent A. Here’s the median monthly organic traffic for all 26 industry categories, ranked highest to lowest, for May 2026. A few things stand out: Authority is the single biggest predictor of traffic, and it isn’t close. The stronger your site (measured here by Domain Rating), the more organic traffic it pulls—and the relationship is exponential, not linear. Across 422,421 websites, median monthly traffic climbs from just 11 clicks at the bottom of the DR scale to 126,364 at the top. That’s not a percentage difference, it’s a four-orders-of-magnitude difference. Every single DR tier earns more median traffic than the one below it, and each jump gets bigger as you climb. To be clear about cause and effect: more backlinks don’t directly summon traffic. What’s happening is that the things that earn a high DR—lots of quality content, strong links, brand recognition—are the same things that earn rankings and clicks. DR is a proxy for the authority that wins traffic, not a dial you turn to get it. The takeaway for newer sites: if you’re under DR 30 and getting a few hundred organic clicks a month, you’re not failing—you’re exactly where the data says you should be. Traffic compounds as authority builds, and the steepest gains come later, not sooner. Bigger sites earn more traffic—and like DR, the relationship is exponential. More indexed pages means more keywords ranked, more queries captured, and more total clicks. Across 324,522 websites, median monthly traffic rises from 18 clicks for the smallest sites (under 10 pages) to 244,772 for the largest (5,000+ pages). More pages is more surface area to rank, and at scale that surface area compounds. But remember: more pages only helps if they’re pages worth ranking. A site that publishes 5,000 thin, near-duplicate pages won’t see this growth—the traffic comes from quality content at scale, not page count for its own sake. Size correlates with traffic because the sites that grow large usually grew by publishing things people search for. The single clearest finding in this data is the enormous gap between the typical small site and the typical large one. Here’s why it’s so wide: What this means for your benchmark Don’t compare your traffic to a big publisher’s, or to last quarter’s industry “average.” Find your row by authority and size in the tables above—that’s your realistic benchmark. Then track your own trend month over month: steady growth against your own baseline matters far more than hitting some global average. To quickly see how your estimated organic traffic compares to your competitors, add their websites to the Competitors chart in Site Explorer: If you’re below the benchmark for your authority and size, here are the levers that actually move organic traffic: One honest caveat: traffic growth is slow, especially early. The DR and size curves above are exponential for a reason—the biggest gains come after you’ve built a base, not in month one. Consistency beats intensity here. So, what’s an average amount of organic traffic? The honest answer is that “average” is the wrong question—the spread is far too wide for one number to mean anything. A typical sub-DR-30 site earns a few hundred clicks a month; a typical DR 90+ site earns over a hundred thousand. Both are “normal.” Use the tables above to find your realistic benchmark by authority and size, then judge yourself against your own trend. And remember the bigger shift: as AI Overviews and answer engines reshape search, the clicks are getting harder to win at the bottom of the curve. Building authority—and getting cited inside the AI answers themselves—is how you climb it.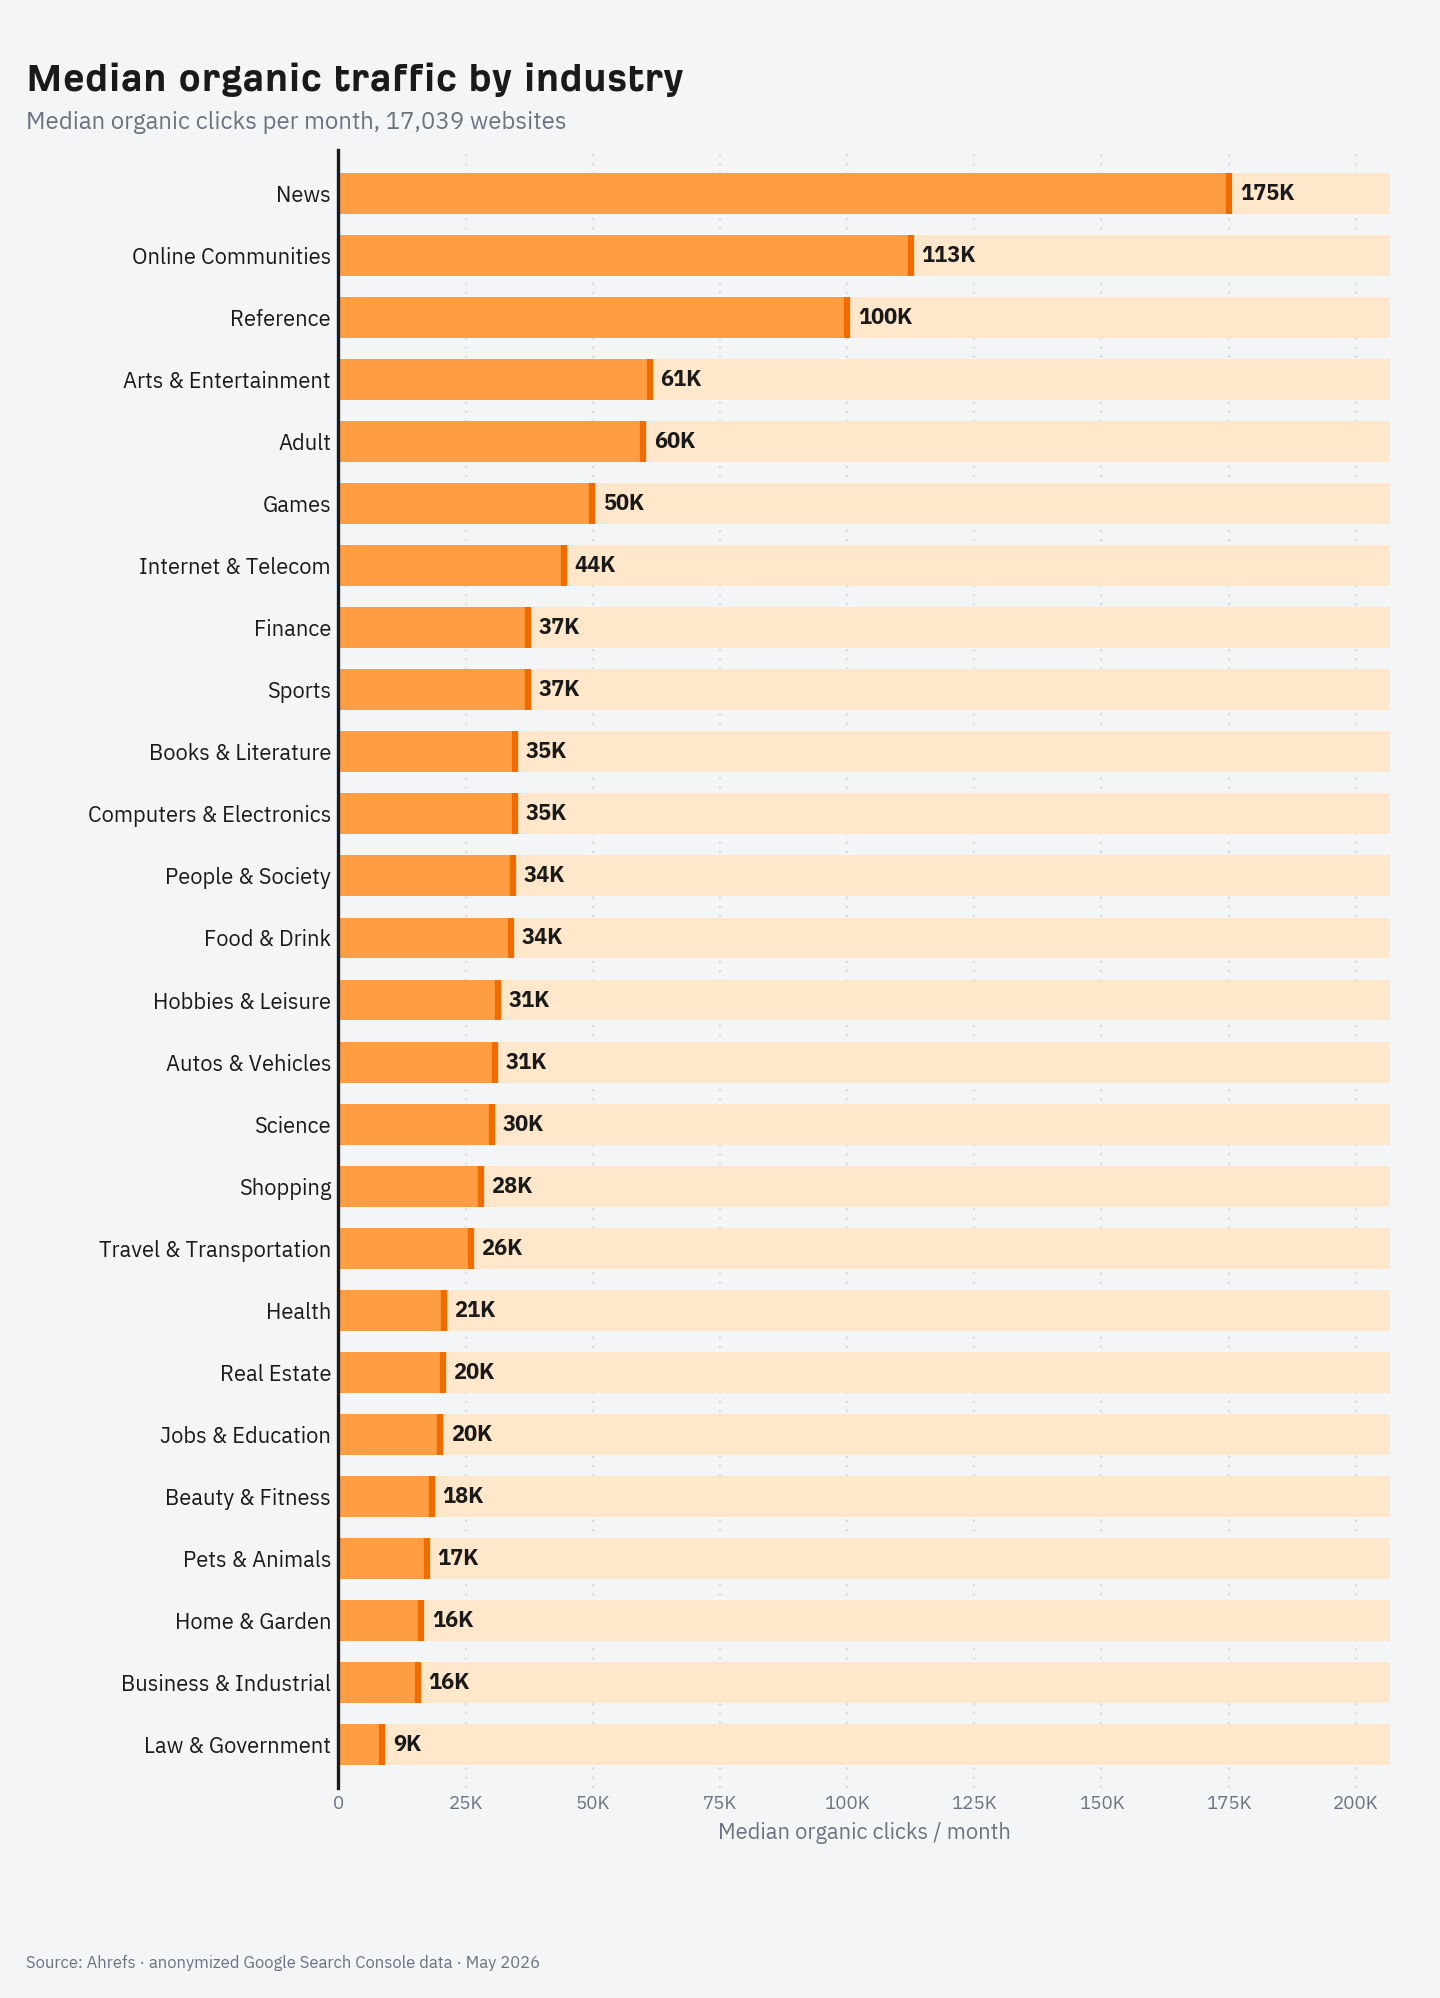
IndustryMedian trafficMean trafficWebsites in sample News 175,115 1,207,529 515 Online Communities 112,517 658,500 21 Reference 100,007 486,647 18 Arts & Entertainment 61,159 612,248 557 Adult 59,870 1,491,791 182 Games 49,828 766,450 684 Internet & Telecom 44,298 586,784 397 Finance 37,346 351,360 1,236 Sports 37,239 533,195 717 Books & Literature 34,736 584,439 86 Computers & Electronics 34,679 2,555,795 535 People & Society 34,291 276,516 293 Food & Drink 33,986 359,333 717 Hobbies & Leisure 31,308 361,396 28 Autos & Vehicles 30,866 248,566 808 Science 30,121 674,795 142 Shopping 27,934 375,711 2,363 Travel & Transportation 25,990 194,639 1,314 Health 20,732 132,539 1,730 Real Estate 20,478 102,643 313 Jobs & Education 20,029 173,885 1,356 Beauty & Fitness 18,362 101,390 201 Pets & Animals 17,326 68,639 266 Home & Garden 16,325 93,440 1,419 Business & Industrial 15,637 123,594 865 Law & Government 8,607 58,452 276 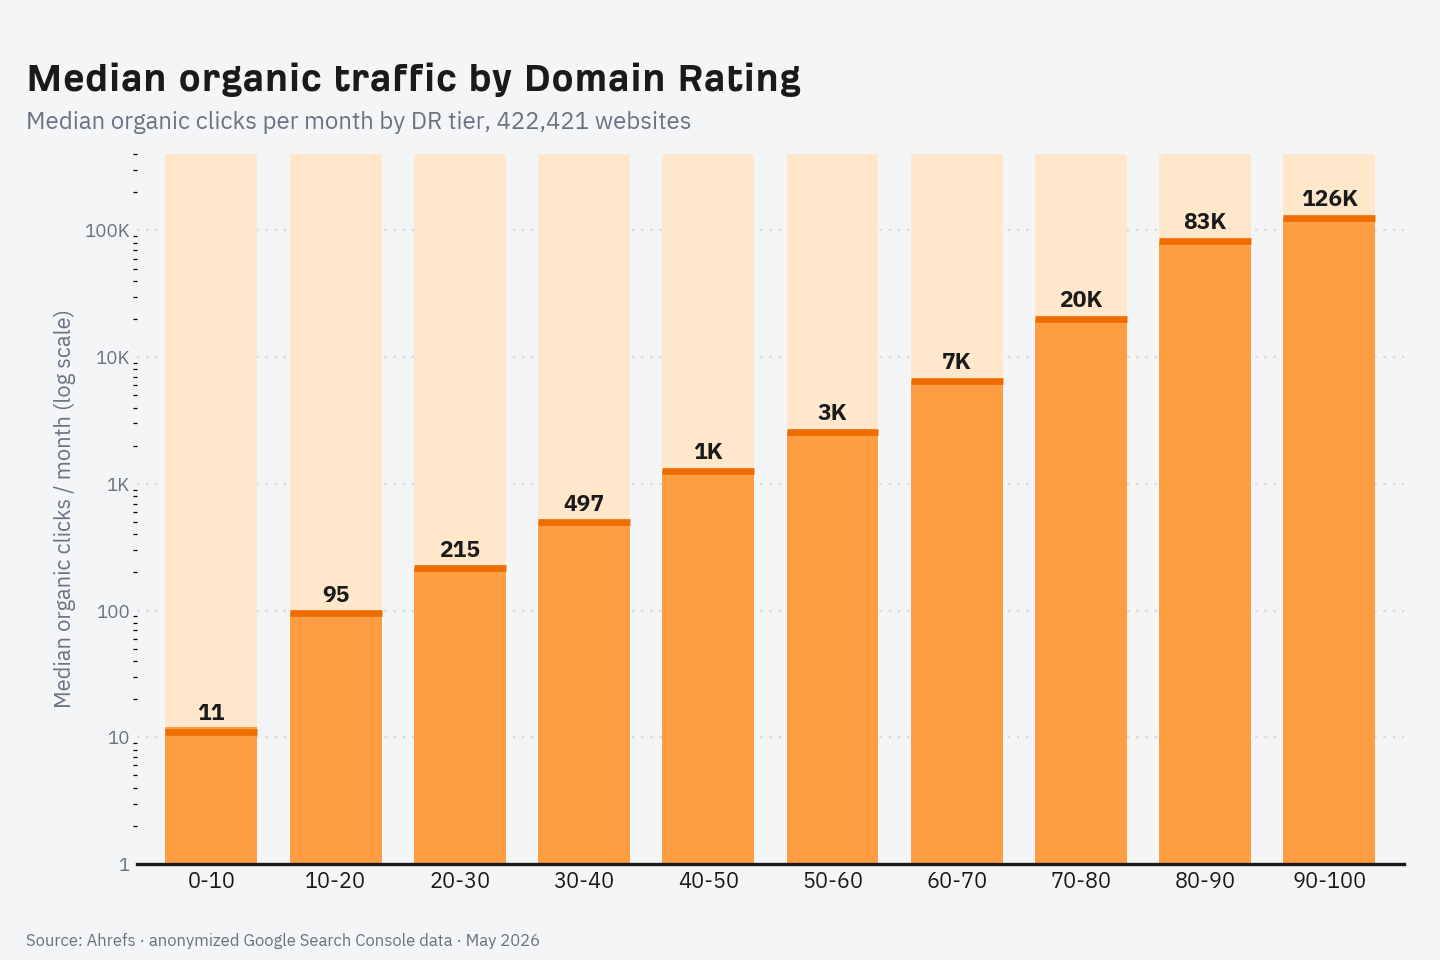
Domain RatingMedian trafficMean trafficWebsites in sample 0-10 11 378 217,565 10-20 95 1,501 59,960 20-30 215 3,541 51,139 30-40 497 7,473 38,447 40-50 1,264 28,181 21,499 50-60 2,567 48,933 15,575 60-70 6,527 120,217 8,344 70-80 19,980 279,757 7,858 80-90 82,743 1,249,038 1,614 90-100 126,364 8,401,539 420 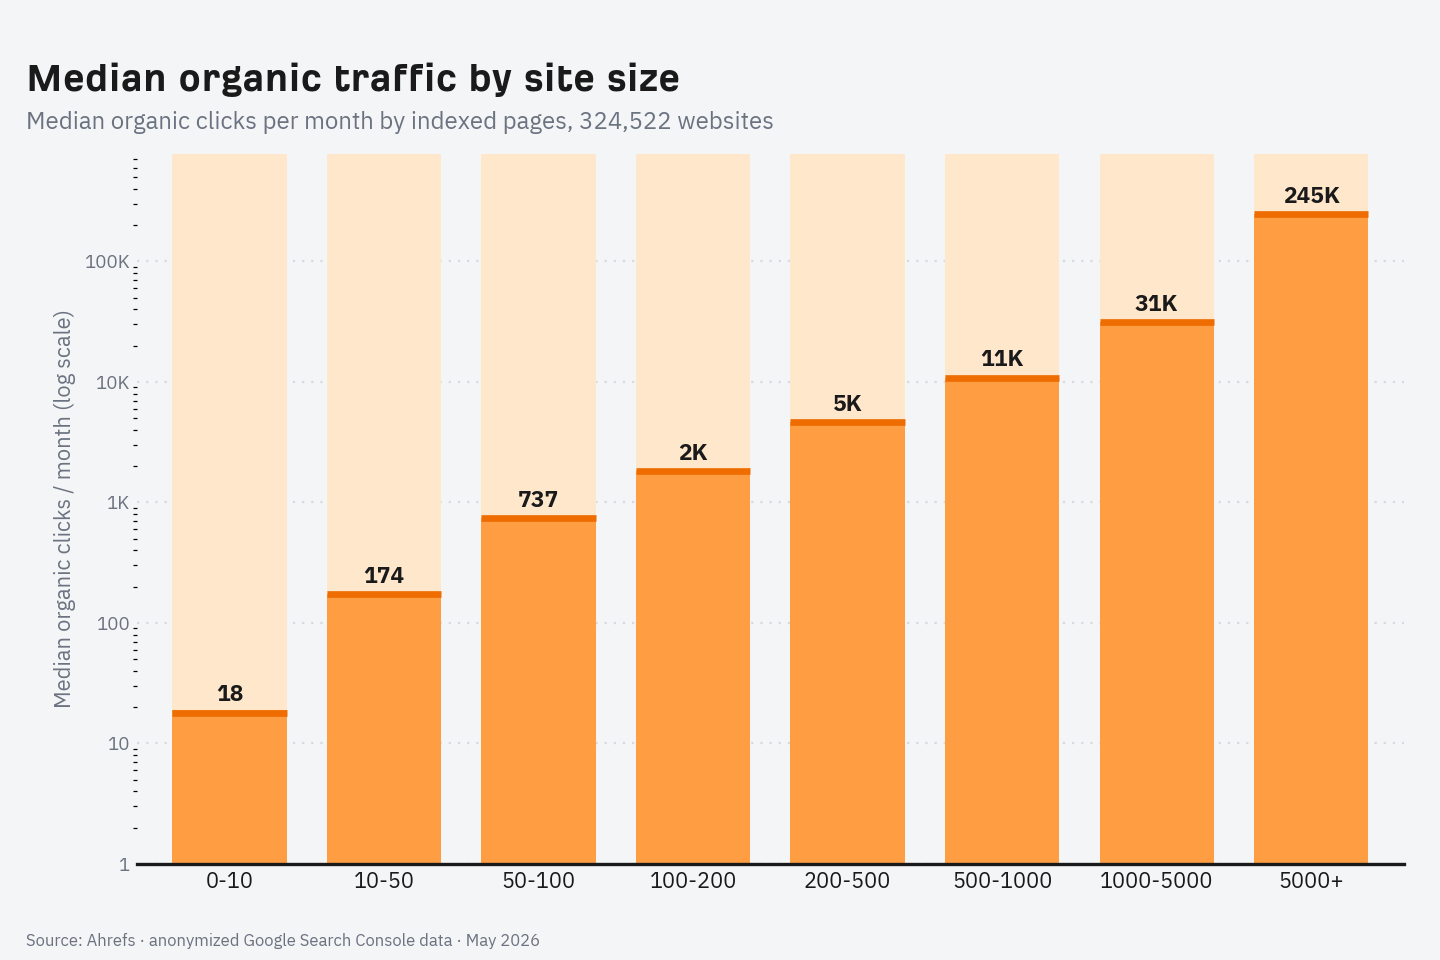
Indexed pagesMedian trafficMean trafficWebsites in sample 0-10 18 587 135,931 10-50 174 2,092 98,839 50-100 737 4,269 29,701 100-200 1,813 16,767 21,192 200-500 4,625 27,280 17,968 500-1000 10,840 48,370 8,217 1000-5000 31,318 199,881 8,910 5000+ 244,772 1,941,966 3,764 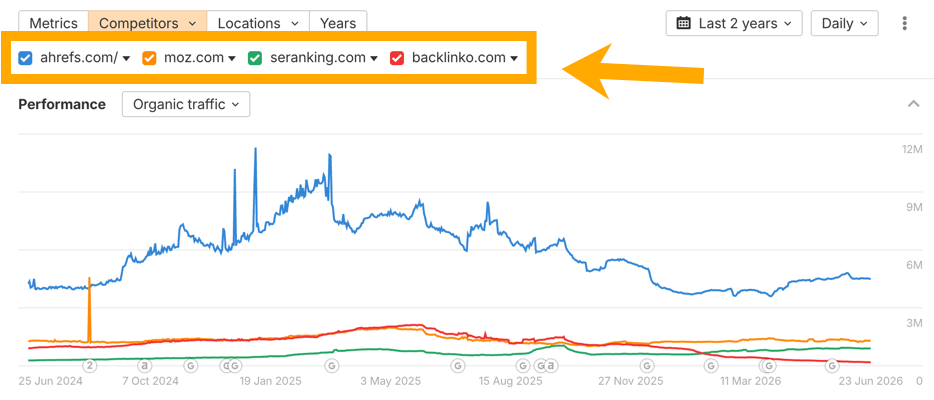
























.jpg&h=630&w=1200&q=100&v=c0f97a310e&c=1)