Food Delivery, Vaccines, Rapid-Test: A Glimpse of COVID’s Impact on Search and SEO
Behind every keyword query is a user’s search intent; the reason a person typed a string of words into the search bar. Check out this analysis from Semrush, the digital marketing platform, to see how people’s relationship to the...
 JimMin
Behind every keyword query is a user’s search intent; the reason a person typed a string of words into the search bar. Check out this analysis from Semrush, the digital marketing platform, to see how people’s relationship to the pandemic changed over time. Want even more SEO trends and traffic benchmarks? Download the complete Semrush State of Search 2022 ebook today.
The surge and decline of keywords is like a mood ring for how the world has felt about the pandemic. As vaccines rolled out, people searched less for COVID testing and more for inoculation. Search intent shifted from playing offense, towards defense.
As restaurants closed and we isolated ourselves inside, demand for food delivery skyrocketed (surprisingly, not for Domino’s pizza!). As travel restrictions eased, people shifted away from restriction-mode to cocktail-on-the-beach mode.
Keyword trends reveal the inner workings of pandemic mindsets. Google became the anonymous helpline for COVID-related worries, hopes, and life planning.
The pandemic also introduced an entirely new vernacular—it changed the way we speak. With that, an array of search terms was created. “PCR” and “rapid-test” were on the tips of our tongues and fingers as people searched for ways to understand their health status.
COVID search trends even showed who we (well, who Google) put trust in. The search engine results page (SERP) for the keyword “coronavirus” gave weight to local authorities over national ones. It preferred data from a privately held company, rather than the world renowned John Hopkins University.
Semrush analyzed search, keyword, and organic traffic data over an 18 month period (March 2020 – August 2021) to see how online user behavior evolved through the lens of COVID. Let’s start with a new way to speak.
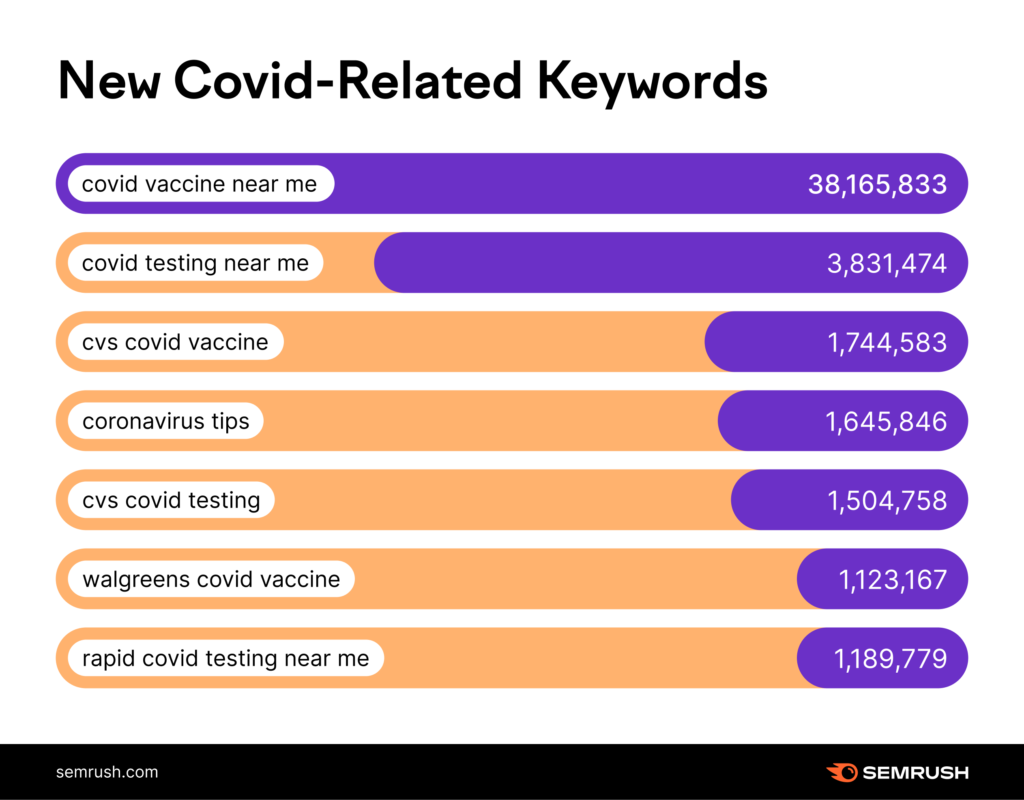
In the US alone, people Googled “covid vaccine near me” over 38 million times every single month. The following keywords had an average monthly search volume of over 1 million from March 2020 – August 2021, in the US.
Some of these terms were not relevant at the onset of the data period (March 2020), as there was no vaccine. That means the current average of some of the keywords is far higher than what you see here!
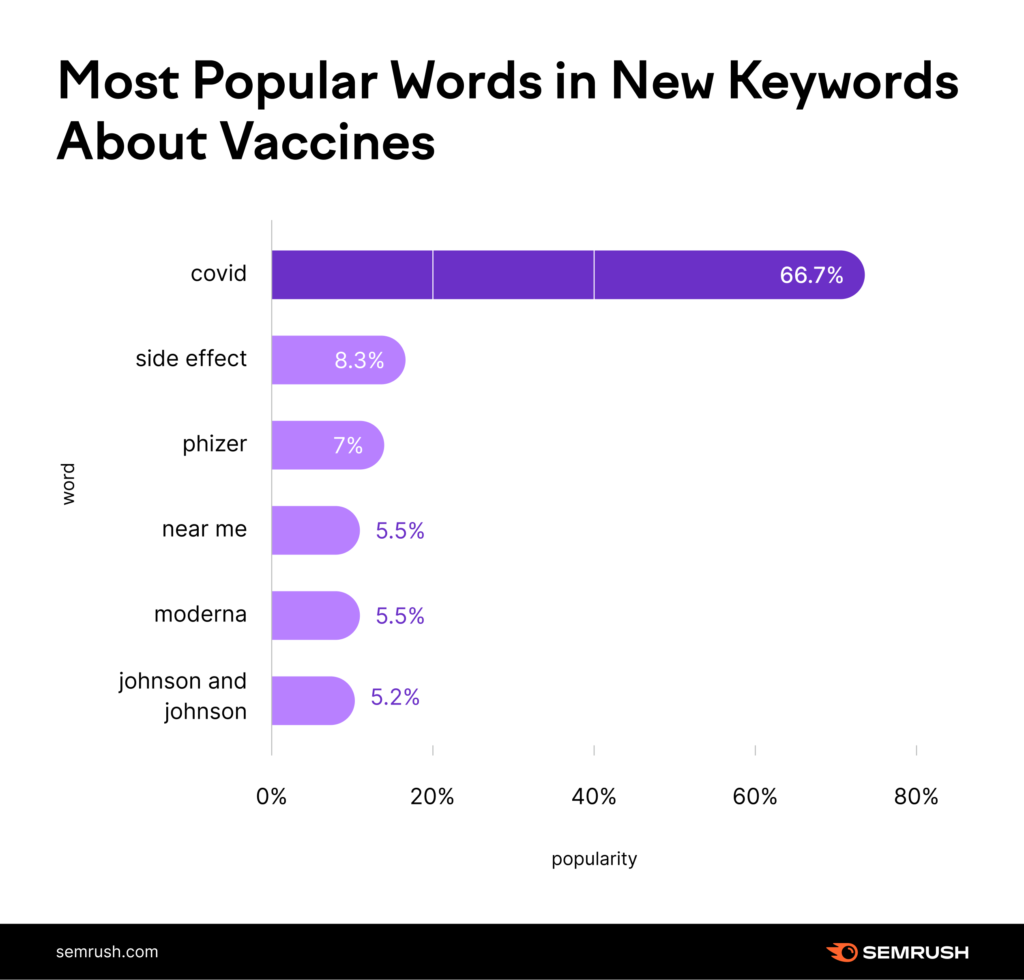
Of the 425 keywords that displayed the most search volume growth in the US since March 2020, here is a breakdown of the most popular terminology found within the keyword set.
Some of these terms were not relevant at the onset of the data period (March 2020), as there was no vaccine. That means the current average of some of the keywords is far higher than what you see here!
Of the 425 keywords that displayed the most search volume growth in the US since March 2020, here is a breakdown of the most popular terminology found within the keyword set.
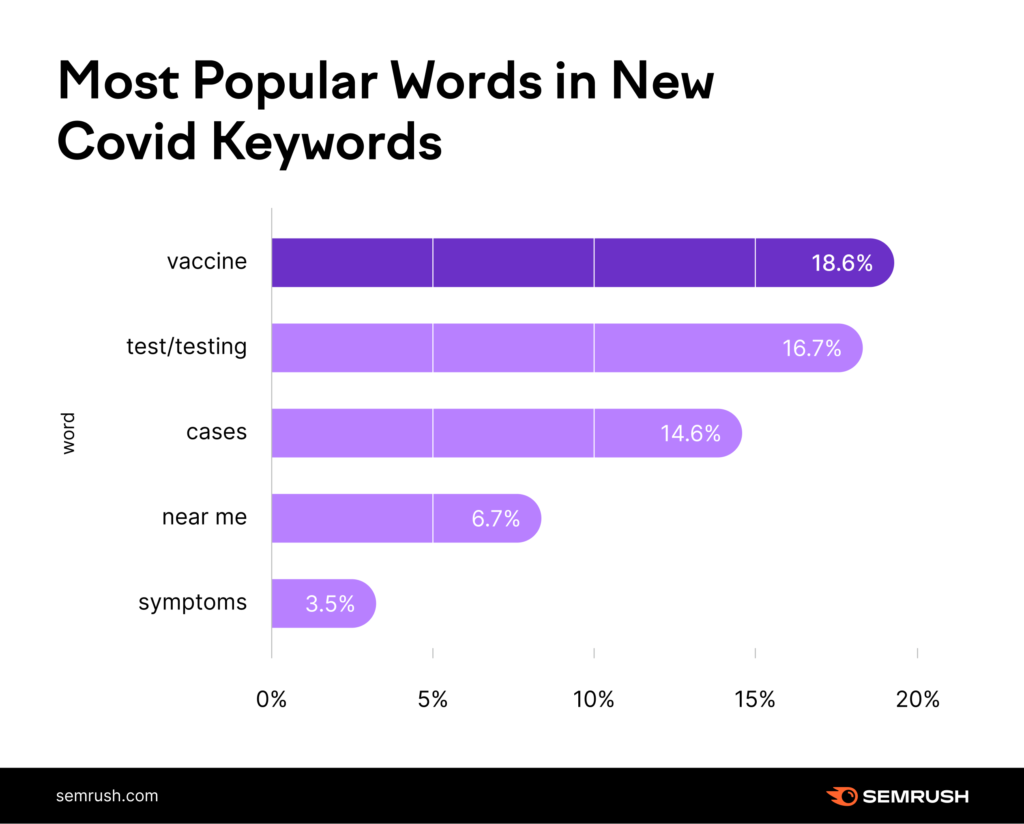
Keywords related to vaccines became more popular than keywords related to COVID testing. This data highlights the yearning for a solution to COVID (vaccines), over a mitigation (tests).
Keyword Changes Over Time
To capture evolving attitudes towards the pandemic, we tracked the increase and decrease in search volume for pandemic-related keywords from June – August 2021. Particularly, to see how the vaccine roll-out impacted what people were searching on Google.
Of the 47 COVID-related keywords that decreased by 40% or more in the designated time frame, here’s what they had in common.
8 keywords (like “covid relief bill” and similar) relate to the COVID stimulus. As there has been no indication of another stimulus in the US, this trend of decreased searches makes sense. 18 keywords (like “covid 19 india” and “covid colorado”) directly relate to or imply a need to understand the number of cases in a location. As the pandemic has dragged on, despite surges, people were less interested in the “numbers.” 9 keywords (like “nose burning coronavirus” and “is coronavirus testing free”) relate to testing or symptoms related to COVID. This decrease may imply that people already knew the routine when it came to testing or identifying signs of COVID infection.Vaccine Keywords
We also looked at 325 of the most popular keywords related to COVID vaccines. Here the average search volume was 44,994 searches per month.
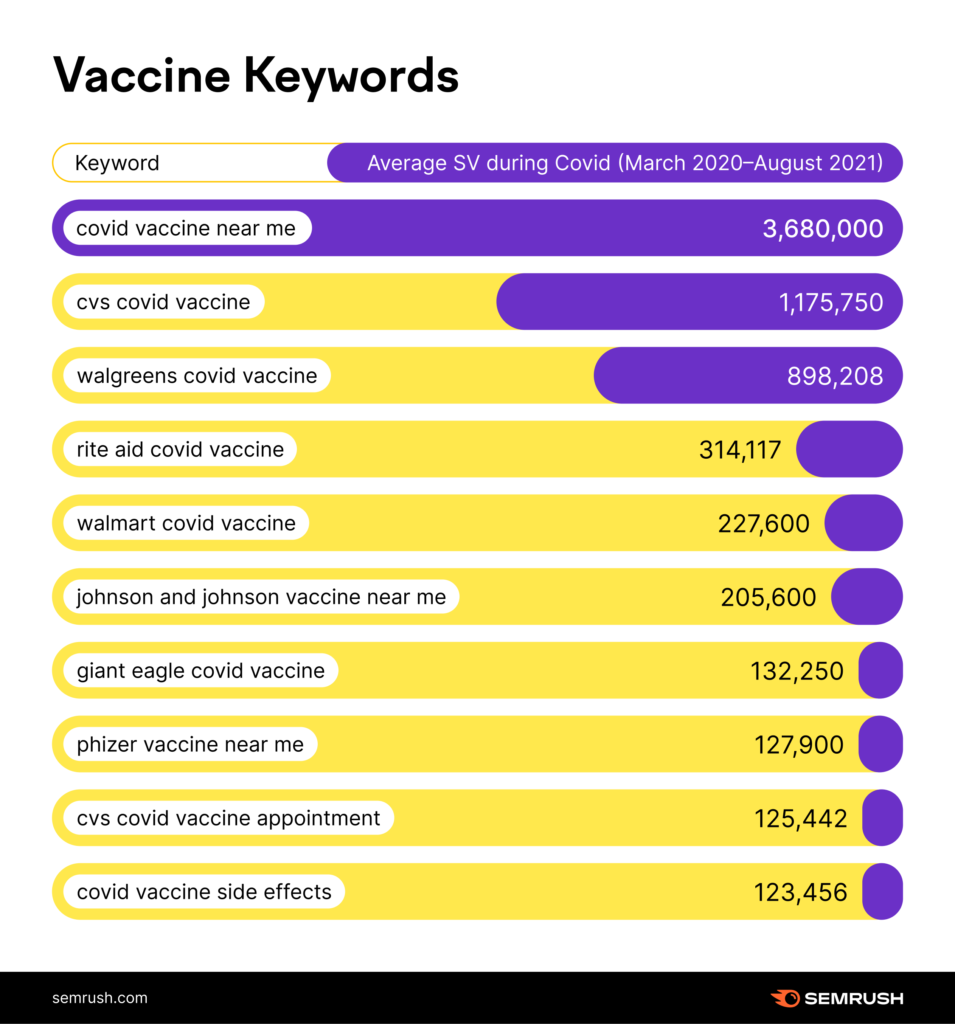
Of the top 10 vaccine-related keywords, 9 of them are about vaccine availability locally, with both the names of the vaccine and/or establishment mentioned in the query itself.
The 10th most popular vaccine-related keyword, “covid vaccine side effects,” speaks to the desire to be informed about decisions related to personal health, with 125K monthly average Google searches.
In fact, keywords that relate to the side effects of the vaccine were evident in over 8% of the most popular vaccine-related keywords, further indicating a desire to be informed. “Side effect” keywords were even more popular than vaccine manufacturers, such as “Pfizer” or “Moderna.”
The Coronavirus SERP
To get a snapshot of the most prominent pandemic authorities (in the eyes of Google), we tracked the most highly ranked sites for the keyword “coronavirus” from March 2020 – September 2021.
Here are the top 10 domains:
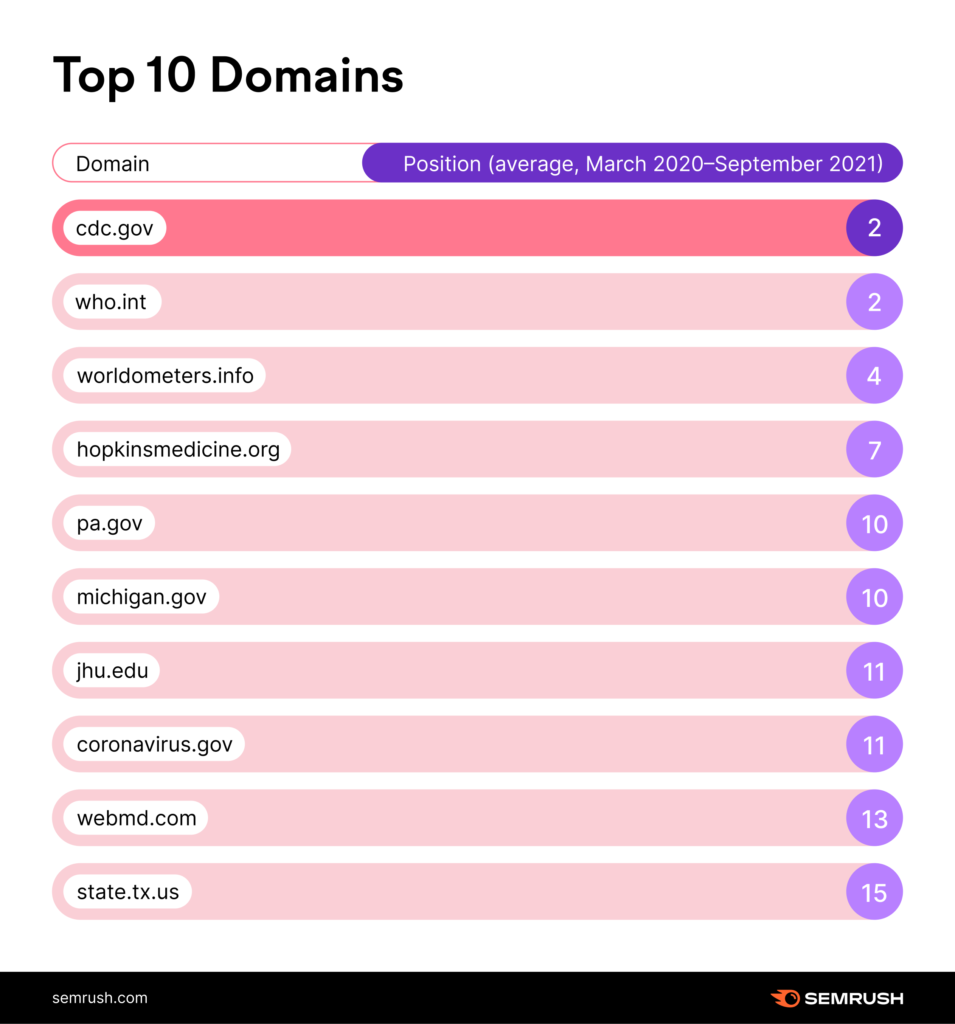
Unsurprisingly, the CDC and the WHO are the top two ranking URLs on average.
When looking at only the top-ranking URLs, of the top 20 domains, 14 are government-run websites. Out of those 14 sites, an astounding 9 of them are local government sites, not national sites. Of those 9, one is a hyper-local domain—lacountry.gov (if you include dc.gov you could argue that 2 out of 9 are hyper-local domains).
Google opted for less national coverage, and more local coverage, on the SERP for this vital keyword, “coronavirus”. This raises the question—why was one state government ranked and another not? For example, New York, one of the hardest-hit states, was not among the top 20 domains.
State-run sites also tended to rank better than other national health sites such as the NIH or even the FDA.
Also noteworthy is the extent to which Google placed trust in the privately run worldometers.info, owned by Dadax, LLC. Worldometers.info was preferred by Google over data collected by Johns Hopkins University—the only .edu on this list.
When looking at the top-ranking domains and considering all of the URLs from those domains that rank among the top 50 results, the results open up a bit.
For example, here the CDC’s coronavirus.gov was the 8th best-ranked site overall, not the 16th. Also, the ArcGIS data dashboard, powered by Johns Hopkins, ranks among the top 20, along with Wikipedia and the more familiar Washington Post.
Still, local government sites dominated with a showing of 7 domains.
Lastly, the IRS appeared on the top 20 list. This was likely an indicator of how important the financial side of the pandemic was to Google, as the IRS site was the epicenter of various stimulus checks.
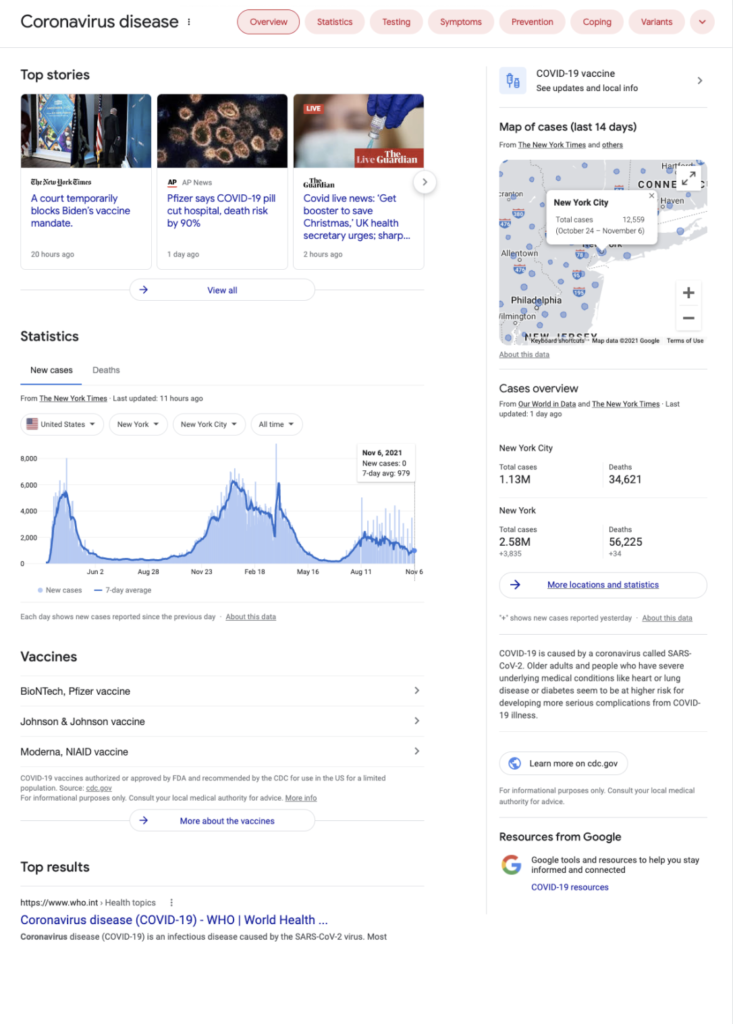
It’s prudent to remember that the top of the SERP, the above the fold section, was dominated by Google’s own properties, powered by various data sources:
 Industry Snapshot: Restaurants
 One of the biggest changes to life during the pandemic was the ability to frequent eateries. As lockdowns became part of normal life there was an obvious shift to takeout and delivery options.
To better qualify this shift, we analyzed the top growing restaurant-related websites as measured by their growth during the first 5 months of the pandemic relative to their organic presence during the 5 months leading up to the pandemic.
Overall, there was a 26.65% increase in organic traffic within the vertical. Here are the top 10 growing sites within the restaurant keyword category, all related to food delivery.
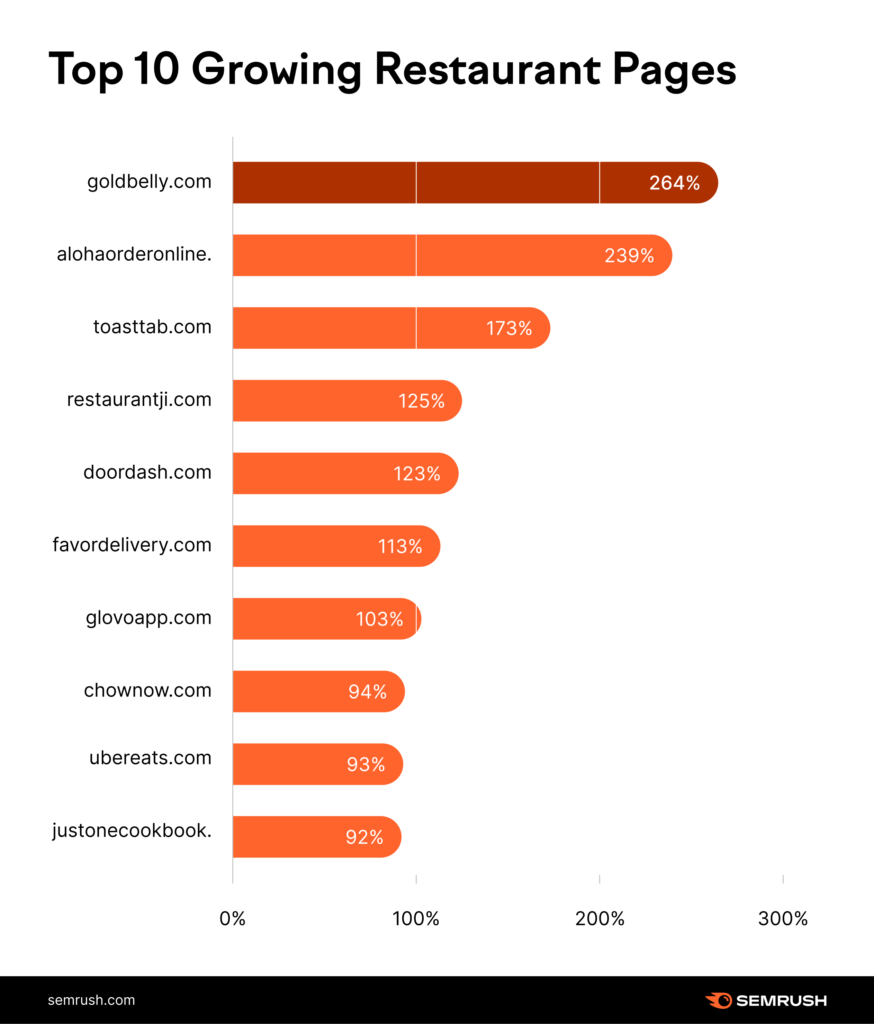
5 of the 10 eatery-related sites with the most organic growth at the onset of the pandemic are related to online food delivery. DoorDash topped the list of such sites with 122.65% organic growth!
However, the top growing site, with 264.26% organic growth was Gold Belly, a site where local eateries are featured for shipping across the US. This might point to the importance of supporting local and smaller establishments during the peak of the pandemic.
The 2nd and 3rd listed sites, “alohaorderonline”and “toasttab” are both related to software solutions to help local restaurants thrive online.
The actual eateries that showed the most organic traffic growth at the onset of the pandemic include:
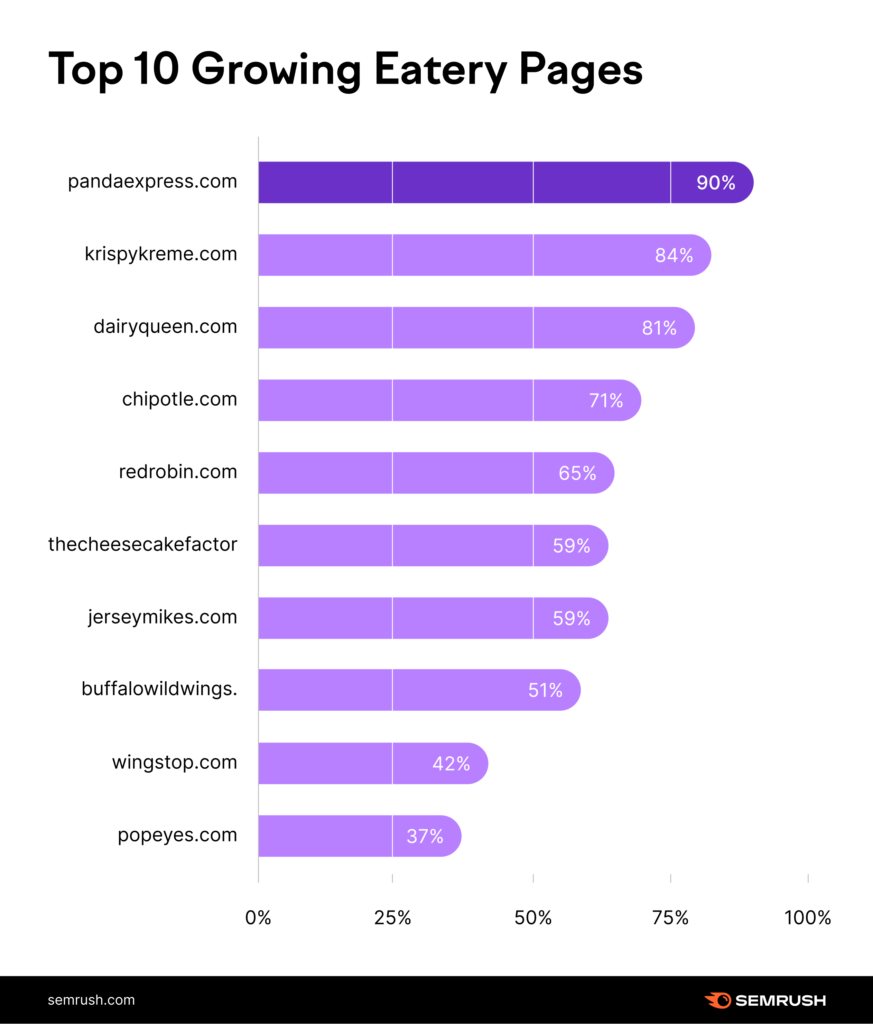
Absent from the list are some of the largest chains such as McDonald’s, Wendy’s, Taco Bell, etc. Perhaps because these fast-food establishments are not known for their delivery services. Dominos, however, clearly known for delivery, is also absent from this list.
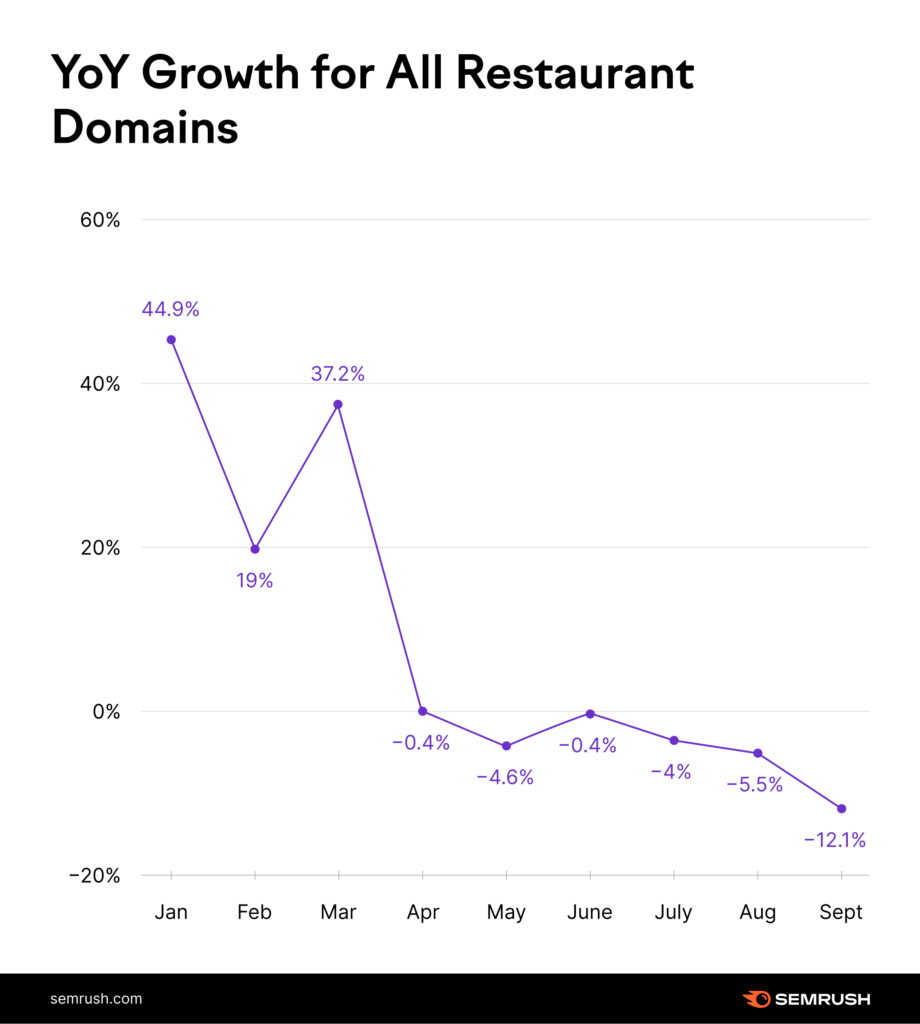
As the world opens, these growth numbers stagger. Heading into the spring of 2021, and summer of 2021, the sites analyzed here were no longer on a growth trajectory. They began a reclining trend towards normalized levels.
 Industry Snapshot: Travel
The travel industry was sent into a tail-spin as countries, cities, and airlines shut down. We analyzed keywords that had little to no searches (search volume) but showed the most growth during the pandemic. The idea is to show how the travel industry and people changed as a result of the pandemic.
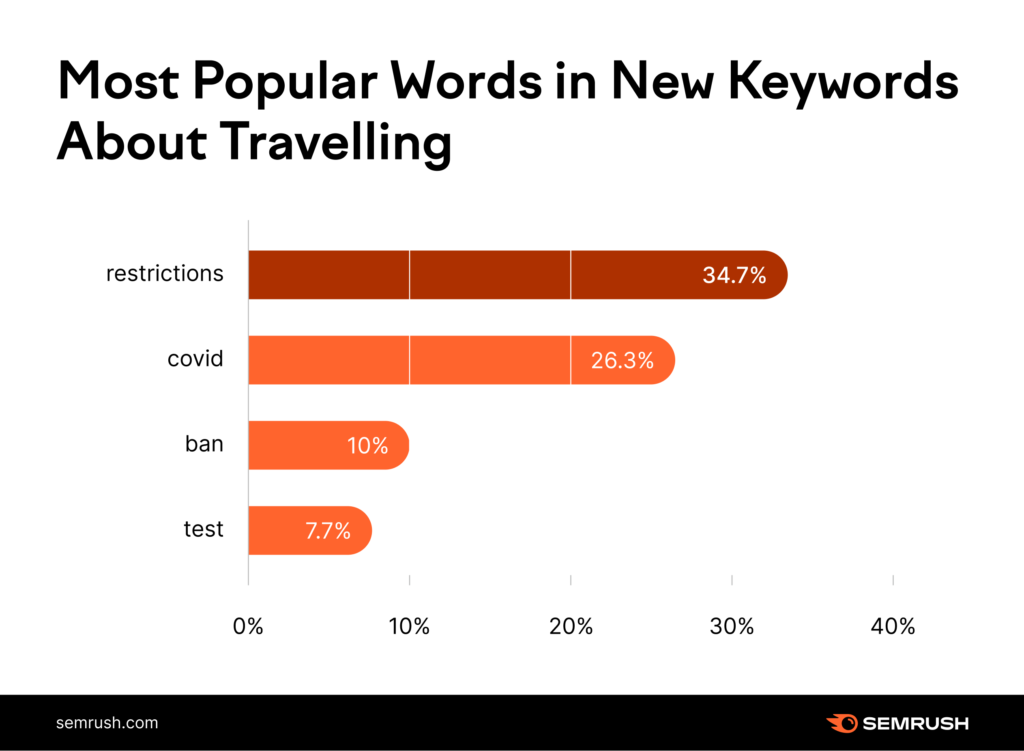
Looking at keywords with the highest average monthly search volumes (March 2020 – August 2021), there’s a predominance towards discussing travel bans and restrictions. Keywords such as “travel hawaii gov,” “pennsylvania travel restrictions,” and “eu travel restrictions” went from nothing to tens of thousands of searches per month.
In fact, the average growth in search volume of the 300 travel/COVID keywords we analyzed is just above 22,000%!
Of these 300 keywords, the following terms were the most frequent. This highlights how user behavior changed when it comes to travel queries and what information is the most relevant.
However, this trend is fading fast. As the world reopens, astounding search volume averages for these keywords have decreased.
Looking at the same keyword set from June – August 2021 (as inoculations rolled out and the US reopened more and more), the same dataset only grew 65%. Meaning, search volume growth for keywords related to bans, restrictions, and COVID was down over 99%!
The data demonstrates a shift away from a “restrictions” perspective of travel. Good news for the travel industry! People are returning to their “normal” mindset around travel.
Organic Traffic on the Web
In 2020, the top 100K sites within our dataset received an average of 1,559,337 visits per month. In 2021, that number jumped to 1,603,418—a 2.83% increase. However, much of the increase is due to levels before the pandemic.
January 2020 – March 2020 the average amount of website traffic was 1,308,556, with a monthly high of 1,405,230 (February 2020). April 2020 saw an average of 1,693,276. Meaning, the pandemic resulted in a 29% increase in traffic.
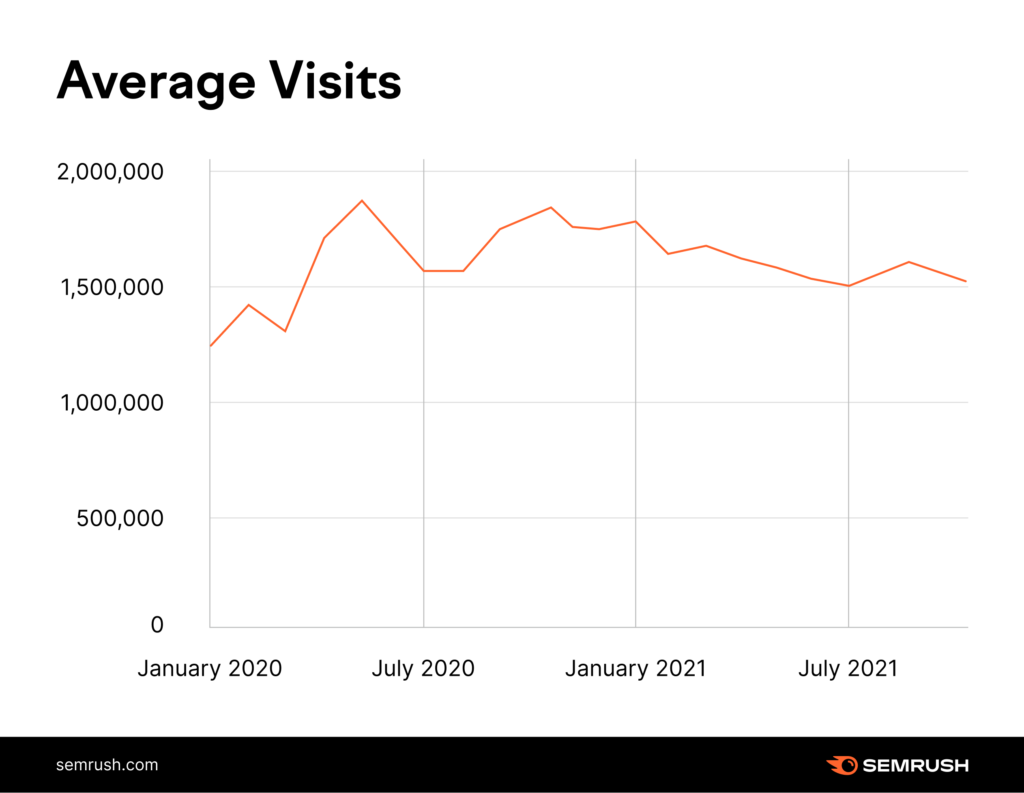
After January 2021, traffic levels came back down. This is perhaps the end of peak COVID traffic and a return to a normalized SERP. What that level of normalization is, remains to be seen.
Ecommerce
The traffic trend supports what is being seen in the ecommerce space specifically. Overall, ecommerce saw a significant shrinking of its collective organic traffic. Year-over-year, overall organic traffic for ecommerce sites decreased 23.24%.
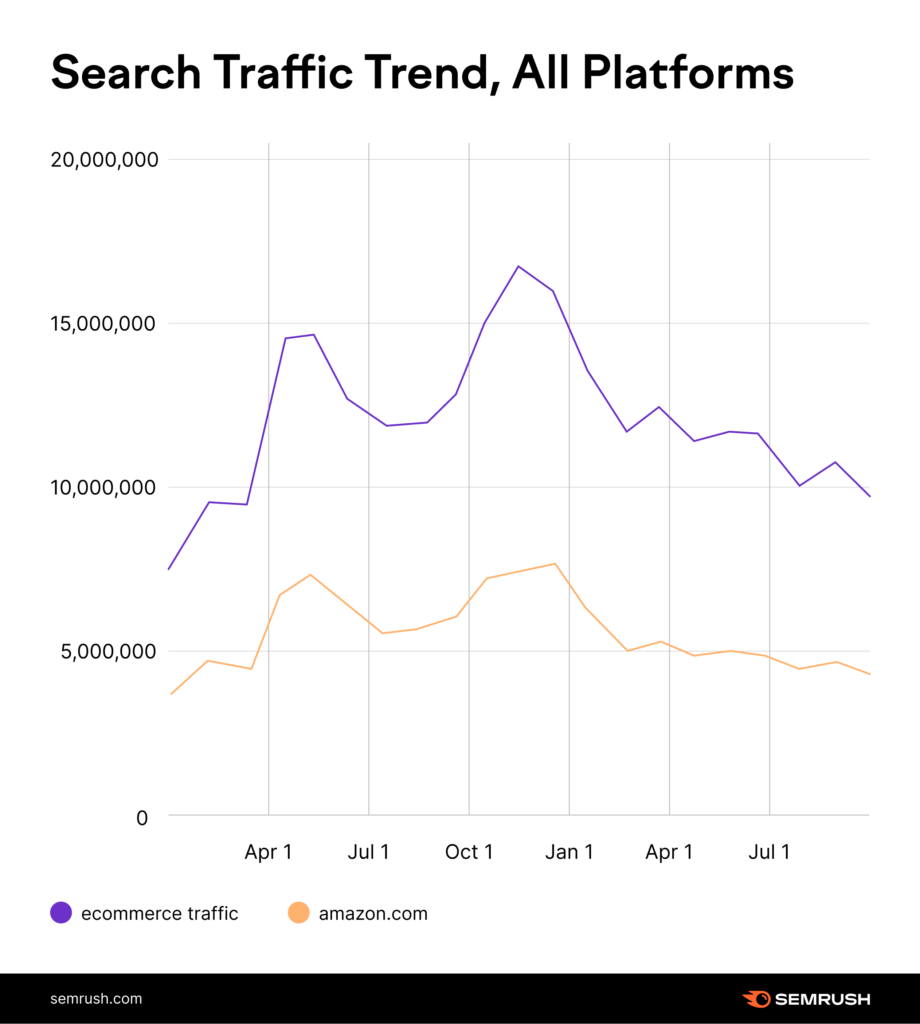
Amazon saw an even more significant downturn with a 37.5% loss of organic traffic compared to 2020. This represents Amazon losing 18.58% of its organic traffic market share.
However, we are not at pre-pandemic levels in this space either.
In fact, the first 3 months of 2020 presented 15% less organic traffic to ecommerce sites than what was recorded between July – September 2021.
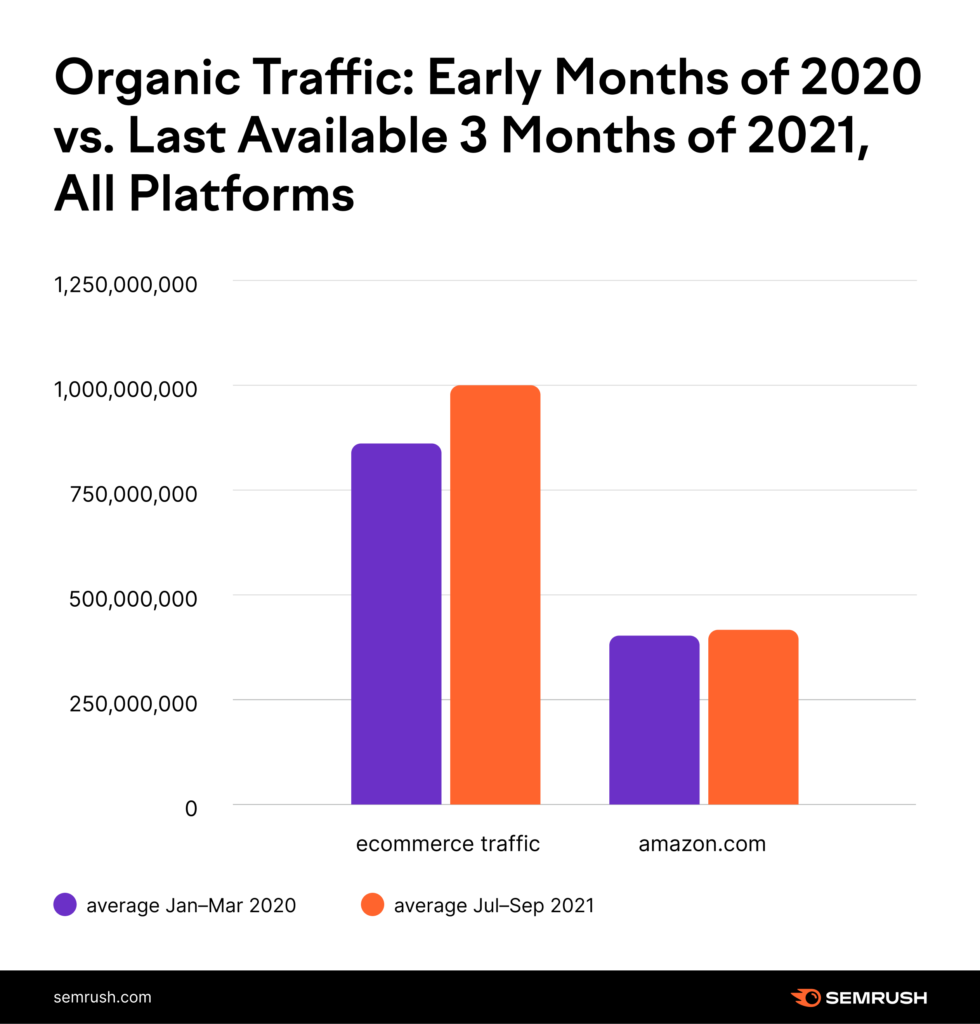
While the world’s ecommerce behavior is returning to pre-COVID levels, we’re not there yet. But, will we ever be?
It’s still unclear if organic traffic within the ecommerce sphere will eventually return to pre-COVID levels or if the pandemic left us with a new normal (15% more organic traffic to ecommerce sites relative to pre-pandemic levels). If the latter, a stabilization point of organic ecommerce traffic remains unknown.
Overall Takeaway
Release of the COVID-19 vaccine put the world on a new trajectory. It also reset the organic marketing landscape. Organic traffic was up overall in 2021, but saw a downturn that began with the slow world reopening. As in-person experiences became safer, people spent less time in front of computer screens and more time out in the world.
Understanding this new context for organic traffic is vital to forecasting organic growth and analyzing performance over the past year. It also means a lot is left unresolved. While it’s highly unlikely the organic landscape will return to pre-COVID levels, we still don’t know what will happen.
The surprising shift in ecommerce sites and Amazon’s weakened grip on the SERP may point towards a new online shopping landscape. Curb-side pickup demand could drop off the face of the earth, or it could just be getting started. Smaller ecommerce players might win SERP ground, or the big boss Google Shopping could sweep it all away.
Keep careful track of changes in patterns but don’t rush to conclusions. It’s important to carefully track what’s happening to your site and what’s happening within the ecosystem itself. The sands are still shifting and no one knows how it will all ultimately play out. Monitoring the situation carefully is the best thing you can do for the success of your site or your client’s site.
To learn more, download the complete Semrush State of Search 2022 ebook. It’s packed with applicable insight into keyword trends, user behavior, and industry benchmarks. If you’re ready to level up your search marketing game, this is the ebook you need.


.jpg&h=630&w=1200&q=100&v=154b70b92d&c=1)