Google PageSpeed Insights Tool: A Complete Blueprint
Trying to load a slow website is like trying to run a marathon in quicksand – frustrating, sluggish, and ultimately fruitless. Whether you’re trying to make a purchase, find information, or simply kill time, a slow-loading website is the...
 ShanonG

Trying to load a slow website is like trying to run a marathon in quicksand – frustrating, sluggish, and ultimately fruitless.
Whether you’re trying to make a purchase, find information, or simply kill time, a slow-loading website is the ultimate buzzkill.
Not only does a slow website drive visitors away, but it also has serious implications for your search engine optimization (SEO).
Google and other search engines prioritize fast-loading sites in their search results, so if your website lags behind the competition, it could be harder for potential customers to find you online.
But don’t despair – there are plenty of ways to speed up your website and improve the user experience.
From optimizing images and compressing files to streamlining your code and leveraging caching, a little optimization can go a long way in the world of web performance.
So don’t let a slow website hold you back – take the reins and give your visitors the speed they crave.
What is Page Speed?
Page speed refers to the time it takes for a web page to load and become fully interactive for the user.
There are several factors that can affect page speed, including the user’s internet connection, the domain’s web hosting service, and the presence of a cache in the browser.
Google measures page speed in two ways: the time it takes for content above the fold (the portion of the web page that is visible without scrolling) to be displayed and the time it takes for the browser to fully render the entire page.
Improving page speed can improve the user experience and may also have an impact on search engine rankings, especially after Google added page speed as one of the ranking factors.
There are some factors that can affect page speed that the site owner has no control over, such as the user’s internet connection. This is perfectly ok in Google’s eyes.
However, there are a few elements under the control of the site owner and these factors must be optimized to ensure that users with pretty decent internet speed can access your website faster.
Certain elements of the web page, such as images, videos, and JavaScript, can impact the site speed, so optimizing them should be a top priority for website owners to rank higher on search engines.
Page speed is very important for the user experience, so Google takes it into account when deciding whether to rank a page higher in search results.
By optimizing your content for site speed, you demonstrate to Google that you care about providing a good experience for your website visitors.
What Is Google PageSpeed Insights Tool?
Google PageSpeed Insights tool analyzes the performance of a web page and provides suggestions for improving its speed.
It gives a score based on how quickly the page loads and provides specific recommendations for improving the page’s performance, such as optimizing images, minifying CSS and JavaScript files, and reducing the number of redirects.
Google PageSpeed Insights also provides data on the page’s performance on mobile devices and desktop computers.
This tool can be useful for website owners and developers who want to improve the speed of their pages and provide a better user experience.
To use Google PageSpeed Insights, follow these steps:
Go to the Google PageSpeed Insights website (https://developers.google.com/speed/pagespeed/insights/) Enter the URL of the web page you want to analyze in the “Enter a URL” field and click “Analyze.” Wait for the analysis to complete. This may take a few seconds or minutes, depending on the size and complexity of the web page. Once the analysis is complete, you will see a score for the web page on both mobile and desktop devices. The score is based on a range of 0-100, with higher scores indicating better performance. Scroll down to see specific recommendations for improving the performance of the web page. These recommendations are divided into two categories: “Opportunities” and “Diagnostics.” Opportunities are specific actions you can take to improve the performance of the web page, such as optimizing images or minifying CSS and JavaScript files. Diagnostics provide additional information about the performance of the web page, such as the time it takes for different elements to load. Click on each recommendation to see more detailed information and specific suggestions for implementation.What is a good Google PageSpeed Insights score?
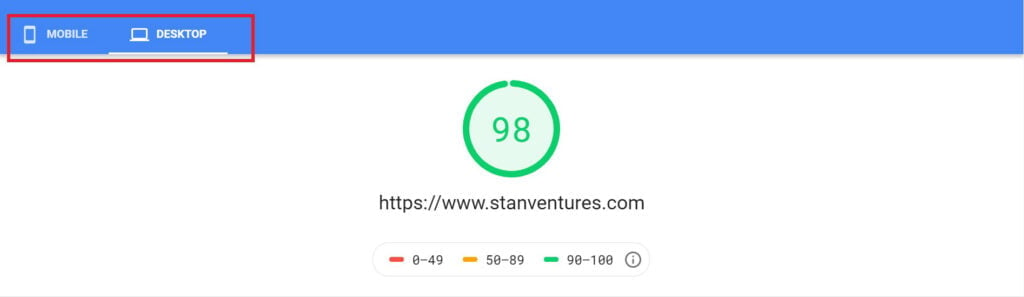
A good Google PageSpeed Insights score is generally considered to be in the range of 80-90 for both mobile and desktop devices.
Good: A good score on PageSpeed Insights indicates that a web page is loading quickly and efficiently. A high score is generally considered to be 85 or above for desktop devices and 90 or above for mobile devices.
Average: A score of 50 or above is considered to be average on PageSpeed Insights, and it means the webmaster has to make a few more optimization to make the site performance better for the users.
Bad: A bad score on PageSpeed Insights generally indicates that a web page is experiencing performance issues and may be loading slowly for users. A score below 50 is generally considered to be poor, and may indicate that there are significant issues with the page’s performance that need to be addressed.
However, it’s important to note that the specific score that is considered “good” can vary depending on the characteristics of your web pages and your specific goals.
For example, if your webpage has a lot of high-resolution images or videos, it may be more difficult to achieve a very high score. And if the intent of the page is to sell the image, you cannot drastically reduce the quality to keep the score high.
It’s also worth noting that Google PageSpeed Insights is just one of many tools that can be used to measure the performance of a webpage, and the specific recommendations provided by the tool may not be applicable or relevant to all websites.
Ultimately, the most important thing is to focus on providing a good user experience, and that can be achieved through a combination of factors, including site speed, design, and content.
What Is Core WebVitals?
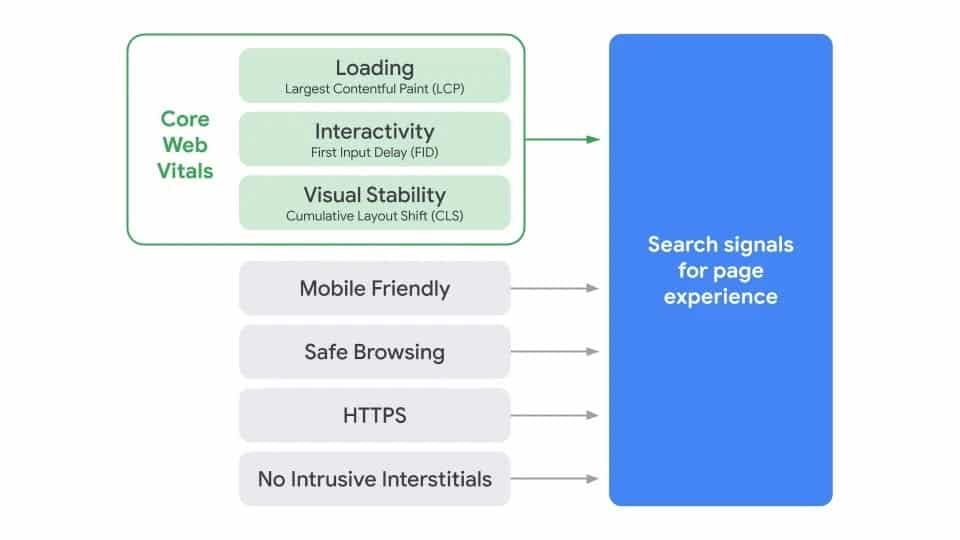
Core Web Vitals is a set of metrics that measure the quality of a user’s experience on a webpage. These metrics are based on real-world data and are designed to capture the essential aspects of a webpage’s performance, such as loading speed, interactivity, and visual stability.
Recommendations related to Core Web Vitals can be found in the Google PageSpeed Insight results. These recommendations will include specific metrics, such as “Largest Contentful Paint” LCP, “First Input Delay” FID and “Cumulative Layout Shift,”CLS and will provide suggestions for improving those metrics.
Google has started considering web vitals as a ranking factor as it provides information about the quality of a user’s experience on a webpage.
By focusing on key metrics such as LCP, FID and CLS, website owners and developers identify and fix problems that can negatively impact the user experience.
For example, if a webpage has a slow loading time, it can be frustrating for users and may lead to high bounce rates (when users leave the site quickly). By measuring and improving the loading time of a webpage, web vitals can help improve the overall user experience and increase the likelihood that users will stay on the site and engage with the content.
Web vitals are also becoming increasingly important for search engine optimization (SEO). Google has stated that it will use web vitals as a ranking factor in its search results, which means that websites with high-performing web vitals may be more likely to rank higher in search results. This can be especially important for businesses and organizations that rely on search engine traffic for their online presence.
What is the Difference Between Page Speed Field Data and Lab Data?
Field data and lab data are two types of page speed data that are used to measure the performance of a webpage.
Field data is collected from real users accessing the webpage from their devices in the real world. It reflects the actual performance of the webpage under real-world conditions, including variations in network conditions, device capabilities, and other factors.
Field data is generally considered to be more representative of the actual user experience, but it can be more difficult to collect and analyze due to the large number of variables involved.
Field data is computed from the Core Web Vitals metrics over the latest 28-day collection period.

Lab data, on the other hand, is collected from simulated testing environments. These environments are designed to closely mimic real-world conditions, but they are controlled and allow for more precise measurements of specific factors.
Lab data can be useful for identifying specific issues with a webpage, but it may not always accurately reflect the actual user experience in the field.
Both field data and lab data can be useful for understanding the performance of a webpage and identifying areas for improvement. It’s important to consider both types of data when evaluating the performance of a webpage and making optimization decisions.
9 User Experience Metrics Within Google PageSpeed Insights
By measuring and improving these 9 user experience factors, website owners and developers can improve the user experience and increase the likelihood that users will stay on the site and engage with the content.
Largest Contentful Paint (LCP)
Largest Contentful Paint (LCP) is a metric that measures the time it takes for the largest content element on a webpage to load and become visible to the user. The “largest content element” is generally defined as the element with the largest dimensions (height and width) that is fully within the viewport (the part of the webpage that is visible on the user’s screen).
LCP is an important metric because it captures the time it takes for the main content of a webpage to become visible to the user. A long LCP can be frustrating for users and may lead to high bounce rates (when users leave the site quickly).
LCP is one of the metrics that is included in the Core Web Vitals, a set of metrics that measure the quality of a user’s experience on a webpage. Google has stated that it will use Core Web Vitals, including LCP, as a ranking factor in its search results, which means that websites with high-performing LCP may be more likely to rank higher in search results.
First Input Delay (FID)
First Input Delay (FID) is a metric that measures the time it takes for a webpage to respond to the first user input. It captures the delay between when a user interacts with the page (e.g., clicks a button, scrolls the page) and when the page responds to that input.
FID is an important metric because it captures the interactivity of a webpage. A long FID can be frustrating for users and may lead to a poor user experience.
FID is another metric that is included in the Core Web Vitals and is directly involved in deciding whether a page passes the core web vitals test.
Cumulative Layout Shift (CLS)
Cumulative Layout Shift (CLS) is a metric that measures the number of unexpected layout shifts that occur on a webpage as it loads. A layout shift occurs when the position of an element on the page changes after the page has started loading, causing other elements to shift as well. This can be caused by elements that are dynamically injected into the page, such as ads or images that are not properly sized.
CLS is an important metric because it captures the visual stability of a webpage. A high CLS can be frustrating for users and may lead to a poor user experience.
CLS is the third most important core web vitals metric and this means that websites with low CLS may have a better chance of ranking higher in search results.
First Contentful Paint (FCP)
First Contentful Paint (FCP) is a metric that measures the time it takes for the first content on a webpage to be visible to the user. The “first content” is generally defined as the first text or image that is fully within the viewport (the part of the webpage that is visible on the user’s screen).
FCP is an important metric because it captures the time it takes for the main content of a webpage to become visible to the user. A long FCP can be frustrating for users and may lead to high bounce rates (when users leave the site quickly).
By measuring and improving FCP, website owners and developers can improve the user experience and increase the likelihood that users will stay on the site and engage with the content.
Interaction to Next Paint (INP)
Interaction to Next Paint (INP) is a metric that measures the time it takes for a webpage to display content after a user interacts with it. It captures the delay between when a user interacts with the page (e.g., clicks a button, scrolls the page) and when the page displays new content as a result of that interaction.
INP is an important metric because it captures the interactivity of a webpage. A long INP can be frustrating for users and may lead to a poor user experience.
INP is not one of the metrics included in the Core Web Vitals, a set of metrics that measure the quality of a user’s experience on a webpage. However, it may be useful for understanding the performance of a webpage and identifying areas for improvement.
Time to First Byte (TTFB)
Time to First Byte (TTFB) is a metric that measures the time it takes for the first byte of data to be received by a web browser after a request is made to a server. It is a measure of the responsiveness of the server and can be influenced by factors such as the distance between the server and the client, the load on the server, and the efficiency of the server’s code.
Time to Interactivity (TTI)
Time to Interactive (TTI) is a performance metric that measures the amount of time it takes for a webpage to become fully interactive.
It is defined as the time when the main thread of the browser is idle, meaning that it is not executing any tasks and all event handlers have been registered.
This is important because it reflects the point at which users can start interacting with the page and receiving a response to their actions. A low TTI is crucial for providing a good user experience, as it means that the page is responsive and can quickly respond to user input.
TTI is usually measured in seconds, and a lower TTI is generally considered to be better for the user experience. There are several factors that can affect TTI, including the amount and complexity of the JavaScript that is being executed, the number and size of resources being loaded, and the overall performance of the server.
To improve TTI, it may be necessary to optimize the code and resources being used, as well as to improve the performance of the server.
Speed Index
Speed Index is a performance metric that measures the perceived loading speed of a webpage. It is based on the visual progress of a webpage as it loads, and it reflects how quickly the content on the page becomes visible to the user.
Speed Index is typically measured in milliseconds, and a lower Speed Index is generally considered to be better for the user experience.
To calculate the Speed Index, a video of the webpage loading is taken, and the visual progression of the page is analyzed.
The Speed Index is calculated by determining the percentage of the page that is visible at each point in time and then comparing this to the time it took to reach that point. The final Speed Index score is the average of all the individual times calculated.
Total Blocking Time (TBT)
Total Blocking Time (TBT) is a performance metric that measures the amount of time that a webpage is blocked from rendering by long-running tasks on the main thread. It is an important metric because it reflects the point at which users can start interacting with the page, and a high TBT can lead to a poor user experience.
Opportunities in Google PageSpeed Insights
In Google’s PageSpeed Insights tool, the “Opportunities” section provides recommendations for improving the performance of a webpage.
These recommendations are based on best practices for optimizing web pages and are designed to help improve the loading speed and overall performance of the page.
Some common recommendations that may be included in the “Opportunities” section include:
Minimizing the size of resources such as images and CSS files Enabling compression to reduce the size of resources Optimizing JavaScript code to improve loading speed Leveraging browser caching to reduce the number of requests that need to be made Optimizing the order in which resources are loaded to improve rendering speedDiagnostics in Google PageSpeed Insights
In Google’s PageSpeed Insights tool, the “Diagnostics” section provides information about potential issues that may be impacting the performance of a webpage. This section is designed to help identify problems that may be slowing down the loading of a page, such as resource-heavy JavaScript files or slow server response times.
The “Diagnostics” section may include recommendations for improving the performance of a webpage, as well as information about specific issues that may be causing problems.
Some common types of issues that may be identified in the “Diagnostics” section include:
Blocking resources that are preventing the page from rendering JavaScript files that are slowing down the loading of the page Large images or other resources that are taking a long time to load Slow server response timesBy addressing the issues identified in the “Diagnostics” section, you can improve the performance of your webpage and provide a better user experience.
Passed Audits in Google PageSpeed Insights
In Google’s PageSpeed Insights tool, a “passed audit” refers to a performance issue that has been successfully addressed and no longer has a negative impact on the loading speed or performance of a webpage.
If you take steps to address these issues and resolve them, Google PageSpeed Insights will recognize this and mark the issue as “passed.” This means that the issue is no longer affecting the performance of the webpage and has been successfully resolved.
The catch here is that Google says the Page Experience Metric is subject to changes as the internet ecosystem evolves.
Google has stated that the new Page Experience metrics will see new additions over the coming years as it plans to evaluate and add new user experience objects annually.
Know Your Core Vitals Score Using Chrome Extension
Before I give you tips to improve the Page Experience score, you need to assess your current website performance.
Thanks again to Google, you have a free Chrome Extension to check the page experience signals by analyzing all three objects within the Core Web Vitals.
Just download it from Github and unpack the extension in your Chrome browser.
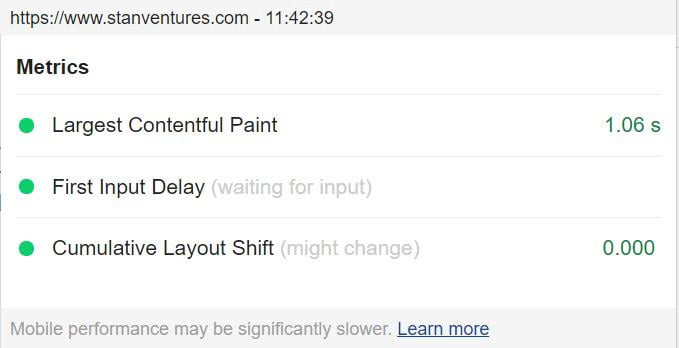
You can see the overall report with details of the individual score received by all three user experience factors.
This is a foolproof and the most recommended extension as it uses the web-vitals library that Google started using in 2021 for ranking and indexing purposes.
How to Analyze Mobile and Desktop Core Web Vitals Scores
Now that you have installed the Chrome extension, you want to check the score.
But before you do that, here is something you must know. The score will be different for mobile and desktop.
Don’t worry, the same extension can be used to check for both devices or if you are not comfortable installing a Google extension for privacy concerns, which we all understand. Just use the Google LightHouse tool or PageSpeed Insight tool.
Both Google tools allow you to analyze the score of your website.
Checking Web Vitals Score Using Google LightHouse
Step 1: Just open the site in your browser

Step 2: Select the “Developer” Option

Step 3: Click on LightHouse Tab on the far right
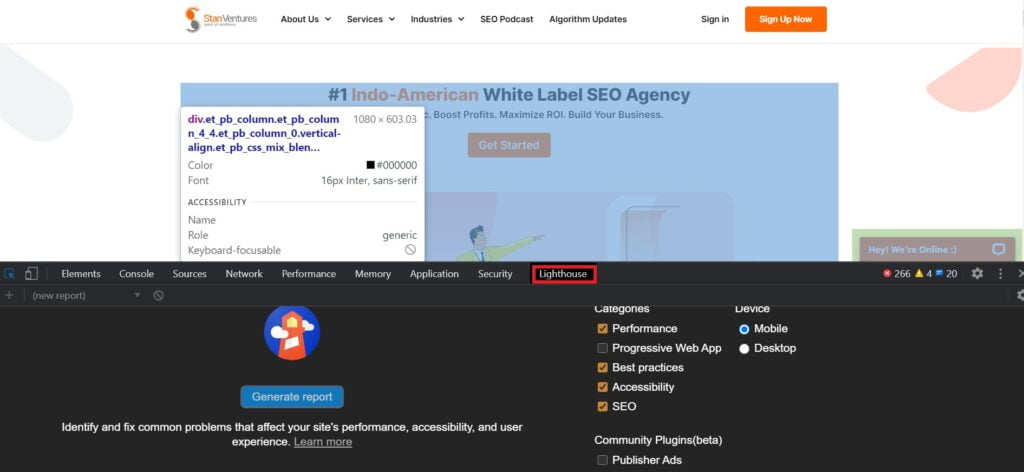
Step 4: Toggle between Mobile and Desktop

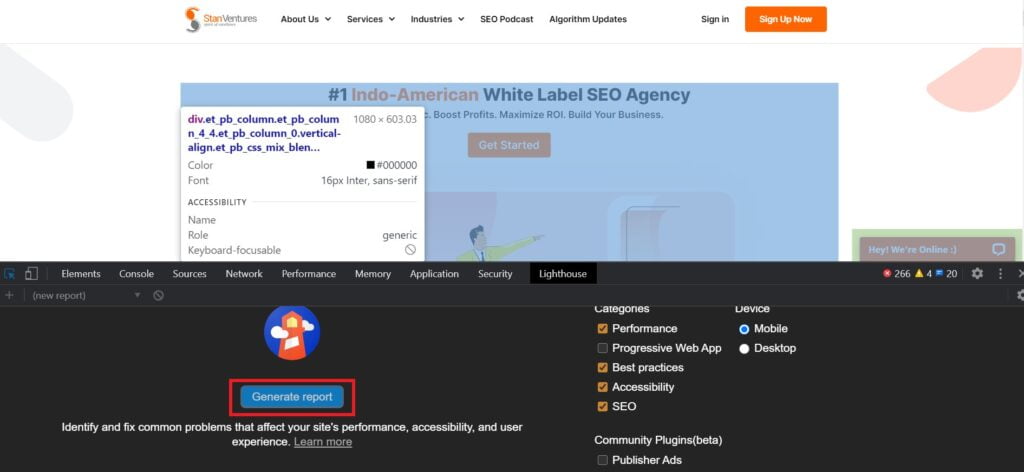
Step 5: Click on Generate Reports and Check the Performance
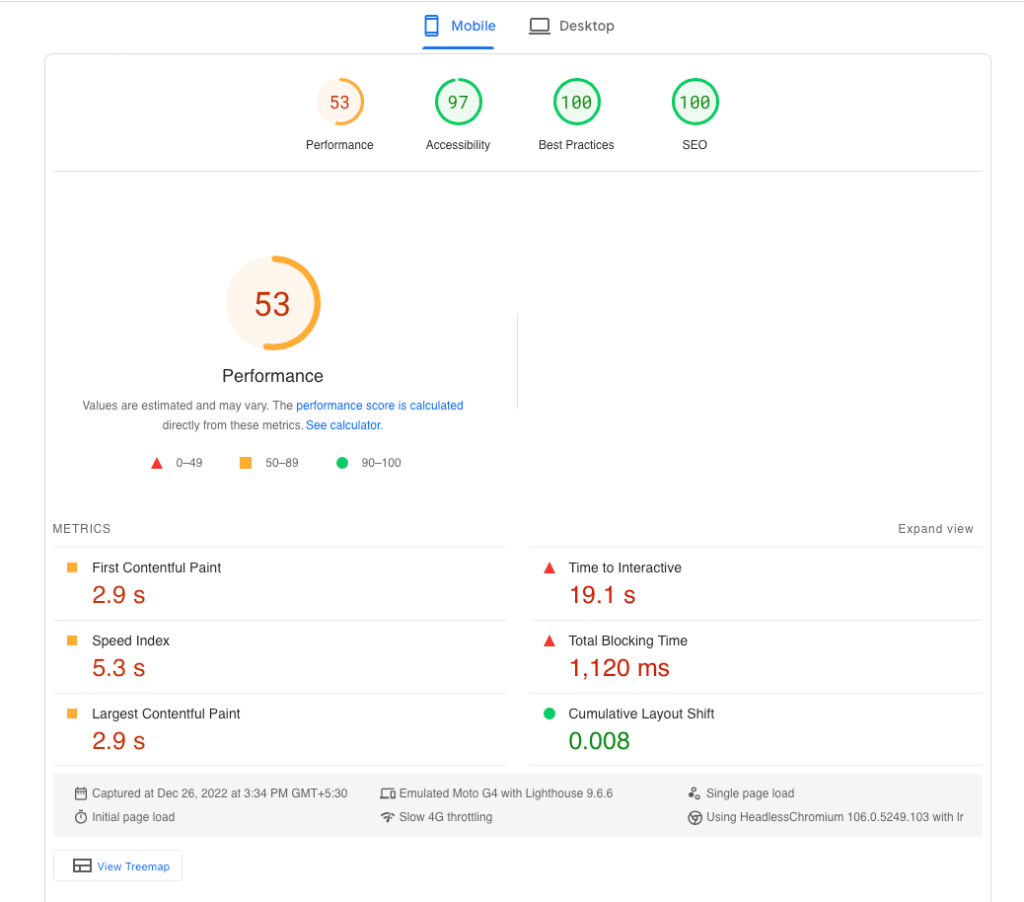
Checking Core Web Vitals Using PageSpeed Insight
NB: PageSpeed Insights Field Data is collected over 28 days. If the page is new and if Google is unable to get enough samples for generating aggregated field data, a simulated load of the page is rendered, and the score is displayed.
Step 1: Go to PageSpeed Insights Tool

Step 2: Input your URL and Analyze

Step 3: Toggle between Mobile and Desktop
Step 4: Look for Field or Stimulated Data (Lab Data)

Field Data
How to Check Core Web Vitals Issues Using Google Search Console
In addition to these Google tools, Search Console also offers a great deal of information about page performance.
Recently, they added the Web Vitals as a Page Experience feature on the search console, which now indicates whether all the pages within the site are Web Vitals compliant.
Checking Page Speed Experience Issues Using Google Search Console
Step 1: Log into Google Search Console Dashboard
Step 2: Click on Core Web Vitals in the Experience Tab
Step 3: Check the Score for Mobile and Desktop Devices
Step 4: Open Reports to See Issues
Good PageSpeed Score Alone Can’t Rank You #1
Let me make this clear to you.
An improved PageSpeed score alone is not the secret recipe to ranking on Google!
Content and links will remain the core elements that decide the primary ranking of a page on search results. Consider Web Vitals as a secondary ranking factor.
Like I always say, Google has over 200+ ranking signals, and not all have the same weightage as the other.
Just don’t orphan content and links from your strategy, as there are many takers for them (your competitors) who are waiting to grab the opportunity.
The Core Web Vitals will find a sweet spot within the same section in Google’s algorithm where intrusive interstitials, mobile-friendly, safe browsing, and HTTPS have been placed.
These are all factors that are directly related to the page experience of the users. However, Web Vitals may get the upper hand or a bigger share of signals when compared to the rest.
We spoke to Garry Grant, the CEO of SEO Inc., a San Diego internet marketing agency about his thoughts on how Pagespeed will play a decisive role in deciding the rankings in the coming days.
Here are some of the key areas that he spoke about.
Page Speed will be at the top of the list in technical SEO for the coming years Page Speed Insights is a great tool for analyzing a site’s page speed. It gives you the page speed score. However, it is not the only tool that one must rely on Therefore, some other tools that can be used by webmasters are Pingdom, GTMetrix, and webpagetest.org siteListen to the whole episode: https://youtu.be/WQPhHwG99SM