Massive CTR Study Reveals Actionable Insights via @sejournal, @martinibuster
Largest ever research study of billions of searches uncovers surprising insights into CTR behavior that provides actionable marketing data The post Massive CTR Study Reveals Actionable Insights appeared first on Search Engine Journal.

seoClarity published a research study of 750 billion and over 30 billion clicks, the largest CTR study ever. The massive research yields multiple insights into Google search CTR behavior that can benefit online marketing strategies today.
The data analysis, which is broken down by device, industry, country and seasonality, uncovers surprising details that may have otherwise gone unknown.
CTR of Top 10 Positions
The top 5 search results positions on desktop averaged 17.16% clicks while on mobile it was less, an average of 15.54%.
What the data revealed, averaged across 17 billion keywords, is that searchers on desktop were more likely to click on the top five search results than those on mobile.
It’s not a giant leap between the two, but there is a difference.
Conversely, users on mobile were more likely to scroll down to click on the bottom of the search results, positions six through ten.
It’s a notable difference between the two.
The summed averages are:
Desktop CTR Position 1: 8.17%Mobile CTR Position 1: 6.74%Advertisement
Continue Reading Below
The pattern of regression for the top ten search positions, which means how much the CTR decreases between positions 1 through 10, is the same between desktop and mobile.
But the click patterns on the top three between mobile and desktop are very different.
seoClarity observes:
“Although the pattern of regression is the same on both devices, it shows that (across a large dataset) ranking in the lower positions on page 1 is actually better for your organic traffic on mobile than it is on desktop.
Presumably, the familiarity of scrolling on mobile devices plays a part in organic CTRs.”
CTR Per Country (All Devices)
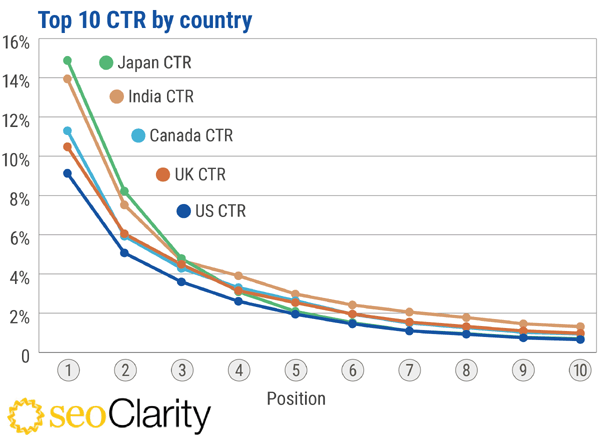
seoClarity reviewed differences in CTR between countries where they had the most data and discovered startling differences.
There is a clear difference in CTRs between countries, with people in the United States less likely to click on the number one position than people searching in the UK, Canada, India or Japan.
Google Search CTR By Country

The percentages below are summed averages between the top twenty positions.
Advertisement
Continue Reading Below
Top 5 CTR for Google Search Position 1 by Country
India 14.88%Japan 13.94%Canada 11.30%UK 10.48%US 9.13%Ranking in position one is important in every country but it is especially important in India and Japan.
seoClarity noticed an interesting CTR pattern for the lower ranking pages:
“Another interesting observation is the CTR in positions 17 through 20. In all 5 countries analyzed, those positions demonstrated a higher average CTR than positions 11 to 16.
We posit that this is reflective of browsing and scrolling behaviors.”
CTR by Seasonality
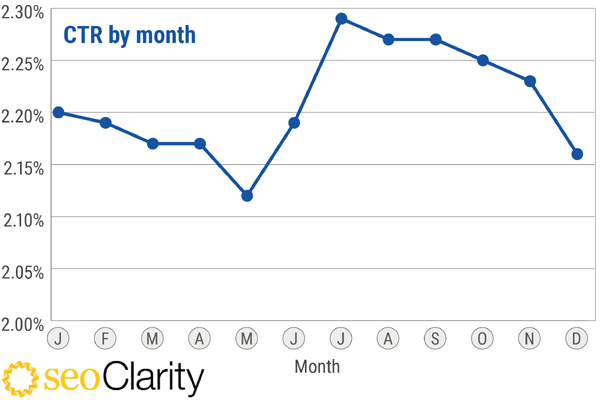
Looked at in a 12 month period, the CTR doesn’t vary a whole lot, it is fairly steady.
The highest CTR is in July at 2.29% and the lowest is in May with 2.12%. That’s a variance of 0.17.
Although that doesn’t seem like much of a difference there is actually an extraordinary difference that needs paying attention to, plus there’s a fascinating insight that goes along with that.
December, when one would expect the CTR to go up is actually the second lowest CTR in the SERPs, with May being the lowest month for CTR. The highest CTR is actually in July.
Here’s the CTR expressed as a graph:
Seasonal Fluctuations of CTR
 seoClarity observes:
“December and Christmas traffic, including the January sales, are very much ‘average’ months when compared to the rest of the year.
This may be because users are migrating more towards the ‘shopping’ listings rather than clicking through the organic listings or increased competition among pay-per-click listings.”
Advertisement
Continue Reading Below
I agree with seoClarity that the jump in CTR during the Summer may be due to vacationers who are researching things to do and places to go while on vacation and clicking through to websites more than usual because of that.
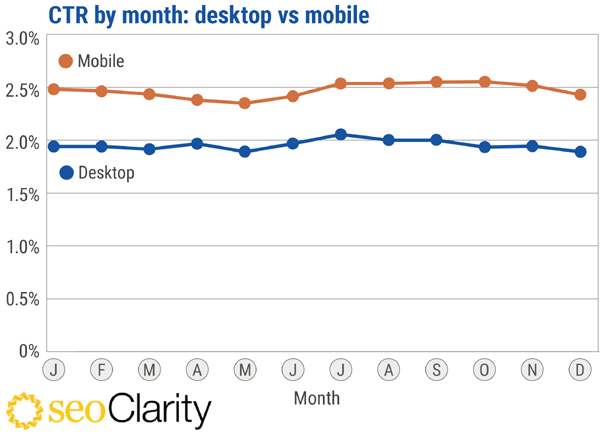
Broken down by device, mobile shows a consistently higher overall CTR than desktop and both display the same seasonal highs and lows.
Seasonal CTR Patterns on Desktop and Mobile Devices

CTR by Industry
The industry that a query belongs to makes a big difference in CTR and whether more of those clicks come from mobile or desktop devices. While it’s important to have a quality site experience regardless of device, knowing which device is going to have a higher clickthrough rate gives a marketer an important insight on their sales and targeting.
Advertisement
Continue Reading Below
CTR in Apparel and Fashion Sectors
Clicks related to fashion search queries are higher on a desktop. While there must surely be variance when broken out by age groups, in general, fashion queries experience a significantly higher CTR on desktop over mobile devices.
CTR in Beauty and Personal Care Sectors
There is a greater search volume for mobile (331m) over desktop (118m).
However, there is an extraordinary difference between desktop and mobile in terms of CTR and incredibly there’s a huge gap between them on clicks to position one.
Sites in position one of Google’s search results on desktop receives 6.65% of all clicks while on mobile sites in position one garners 4.74% of all clicks.
As a reminder, these aren’t a straight percentage measurement of clicks (like position one receives XX% of clicks) but rather an average of all the clicks, as explained above.
CTR in Business And Industrial Sectors
The results for the business and industrial sectors are a bit of a shocker because there were more searches for business content carried out on mobile devices than on desktop.
Advertisement
Continue Reading Below
According to seoClarity:
“Somewhat surprisingly, most searches in the business and industrial sectors come from mobile devices (1b impressions), which is 54% higher than the volume on desktop (649m).”
Additionally the CTR for mobile is less concentrated on position one as compared to desktop, meaning that the CTR is more spread out across the SERPs in mobile than on desktop, where the clicks tended to cluster in the top ranks.
Position 1 of Google SERPs
Mobile: 6.66%Desktop: 8.60%Position 2 of Google SERPs
Mobile: 3.79%Desktop: 4.44%Advertisement
Continue Reading Below
Position 3 of Google SERPs
Mobile: 2.41%Desktop: 2.55%More searchers on mobile devices clicked on sites listed on positions 5 through 10 (except for position 6) compared with users on desktop devices.
Consumer Electronics
A similar CTR trend to Business and Industry manifests in the consumer electronics sector as well. There are more searches in mobile but less clicks concentrated in the top three positions than they are on desktop devices.
Top 3 CTR Dominates Desktop Devices More Than in Mobile
The trend toward a concentration of clicks in the top 3 for desktop devices in comparison with mobile devices is exhibited in almost every niche, except for the Finance sector where desktop and mobile device CTR in the top 3 are essentially tied.
Sectors Where Top 3 Dominates Desktop SERPs
Apparel and FashionBeauty and Personal CareBusiness and IndustrialConsumer ElectronicsHealthHome and GardenJobs and EducationSports and FitnessVehicles & AutomotiveAdvertisement
Continue Reading Below
Sectors Where Top 3 Dominates Mobile SERPs
Real EstateRetail & eCommerceTravel & TourismWhy Are Top SERPs Less Popular in Mobile?
seoClarity surmised that mobile users are accustomed to scrolling and that’s why they tend to scroll past the top three to five search results more often than users on desktop devices.
It may also be possible that mobile devices have more situational contexts, additional search intents, than desktop devices.
Mobile device personalization could play a role in why mobile device users scroll past the top three to five search results.
seoClarity Research is Available Now
Read the full 53 page report on seoClarity for additional insights that can improve and enhance your marketing strategies, as this article only touches a few of the insights uncovered in this study that is the largest of its kind.
Download the research paper here:
Advertisement
Continue Reading Below

 Kass
Kass 


