The Decisiveness of Statistical Inference
Statistical inference definition: the theory, methods, and practice of forming judgments about the parameters of a population and the reliability of statistical relationships, typically on the basis of random sampling.
 JimMin

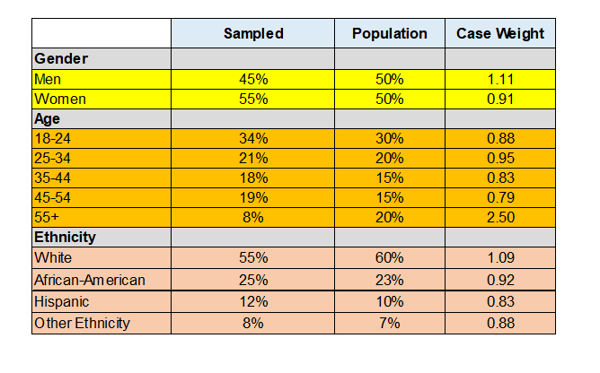
Put another way: Burger King serves approximately 16 million people a day worldwide. Burger King would like to know the key drivers to it overall sales among, say, 11 attributes. How much would it cost to ask all of Burger King’s customers and then do the appropriate multivariate analysis? Well, let’s figure it costs about $2 per answer, $32 million. Or Burger King could take a representative sample of, say, 1,000 customers for three subgroups—a total of 3,000 surveys—and run the same analysis. The law of statistical inference suggests that the answers provided by the sample of 3,000 would be very much the same as the answers provided by all of Burger King’s customers, within an error range of about 3%. Below is an example chart where Burger King has asked 3,000 customers, one from each of the three groups represented on the chart, what they think about 11 attributes. Survey research and political polling are heavily reliant on probability models. That is, the projection of the answers of a few onto an entire population. These projects are always quite accurate due to the concept of probability models. A probability model is a mathematical representation of a random phenomenon. It is defined by its sample space, events within the sample space, and probabilities associated with each event. The sample space S for a probability model is the set of all possible outcomes. Probability is the number of times our outcome would prevail. In other words, you have [your event]/[sum of all possible events]. For example, when you flip a coin, there are two possible outcomes, heads or tails. If you are looking for the probability of tossing heads, the answer is ½, or 50%. When you roll a dice, the chances of rolling a 4 is 1/6, or 16%. This is a broad simplification of a complex definition, but explains why our survey sample, though representative of the entire university, is correctly within a certain probability. Are the answers from 1000 able to project onto a total sample size of 100,000. The confidence interval is 3%, so we are 97% sure that our answers from the representative sample is correct. Let’s move on to the accuracy of survey research to gauge brand equity, consumer sentiment, political polls, etc. In these cases we use probability samples to get our most accurate picture. A probability sampling method is any method of sampling that utilizes some form of random selection. In order to have a random selection method, you must set up some process or procedure that assures that the different units in your population have equal probabilities of being chosen. That is, if a study is being done on Wal-Mart shoppers, and your sample is Wal-Mart shoppers, randomly choosing 1000 people to survey is an example of a probability sample. In general researchers prefer probability sampling. The difference between nonprobability and probability sampling is that nonprobability sampling does not involve random selection and probability sampling does. Examples of nonprobability sampling include: Non-probability and quota samples are very common in survey research. A good example is the phenomena of over-sampling. Lexus would like to gauge its corporate brand love story. They take a random sample of Drivers 18+, asking questions of brand image. Then they oversample the key demographic, owners of the automobile brand between the ages of 34-55 – these folks have more communication value than the population at large. Lexus owners have an average age of 45 in 2019. They oversample young, affluent customers because that is the market they would like to penetrate. Weighting adjusts the poll data in an attempt to ensure that the sample more accurately reflects the characteristics of the population from which it was drawn and to which an inference will be made. Weighting amplifying answers of people under represented or lower voice of those over represented. Weighting is used to adjust the relative contribution of the respondents, but it does not involve any changes to the actual answers to survey questions. A good way to look view case weights is to show a group is [Percentage in Sample Population]/[Sample in Actual Sample]. The Table, below, shows how to create demographics weights for a study. In more sophisticated weighting schemes weight from all three dimensions can be balanced. Finally we will touch on the subject of non-response bias. Nonresponse bias occurs when some respondents included in the sample do not respond. The key difference here is that the error comes from an absence of respondents instead of the collection of erroneous data. Most often, this form of bias is created by refusals to participate or the inability to reach some respondents. Nonresponse is a problem for survey quality because it almost always introduces systematic bias into the data. This results in poorer data quality and can significantly bias any estimates derived from the data. There are several techniques researchers can use to minimize nonresponse and to offset the bias it introduces into data. During the data collection period, researchers can use: When designing a study, statistical inference, probability modeling and weighting vital for methodological and ethical reasons, as well as for reasons financial resources The understanding of the terms and effects of the subjects covered in this brief summary can build an understanding and foundation in the field of empirical survey research. Editor's note: Michael Lieberman is founder and president of Multivariate Solutions, a New York consulting firm offering comprehensive statistical consulting. He can be reached at 646-257-3794 or at michael@mvsolution.com. Statistical inference definition: the theory, methods, and practice of forming judgments about the parameters of a population and the reliability of statistical relationships, typically on the basis of random sampling.
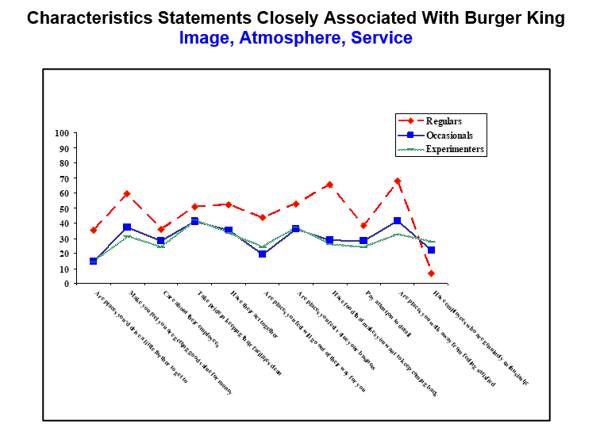 Burger King would then be able to make decisions on marketing and messaging based on the sample Regulars, Occasionals, and Experimenters without having to ask all the people in these categories worldwide. With inferential statistics, you are trying to reach conclusions that extend beyond the immediate data alone. We use inferential statistics to try to infer from the sample data what the population might think. We use inferential statistics to make inferences from our data to more general conditions through the use of probability models.
Probability Sampling vs. Non-Probability Sample
Weighting Poll Data
 To display a simple use of weights, below is a table of weighted average, the grading system of a statistics class. The percentage of grade is, in fact, a case weight. The final grade is a weighted average.
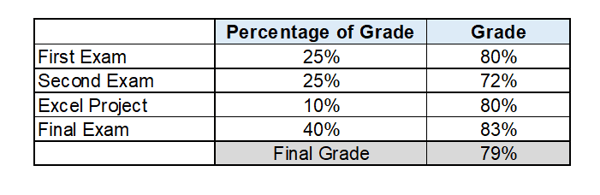 Non-Response Bias in Surveys