4 Types Of Data Campaigns In Digital PR For SEO via @sejournal, @_kevinrowe
Emphasize audience engagement, trust-building, and data-driven storytelling over traditional link building and experience the impact beyond links. The post 4 Types Of Data Campaigns In Digital PR For SEO appeared first on Search Engine Journal.

Digital PR for SEO has exploded as the ultimate link building alternative.
Digital PR is an alternative because it’s not a method just for links; it’s a method to enable an audience to share your content, a journalist to share your expertise, and buyers to trust your brand.
Links are a delightful consequence.
However, certain types of campaigns generate more links and shares than others.
Online audiences engage with and use data that has easy-to-understand visuals that tell a compelling story.
A simple example is my LinkedIn post, which generated over 57,000 impressions, 80 comments, and 190 likes.
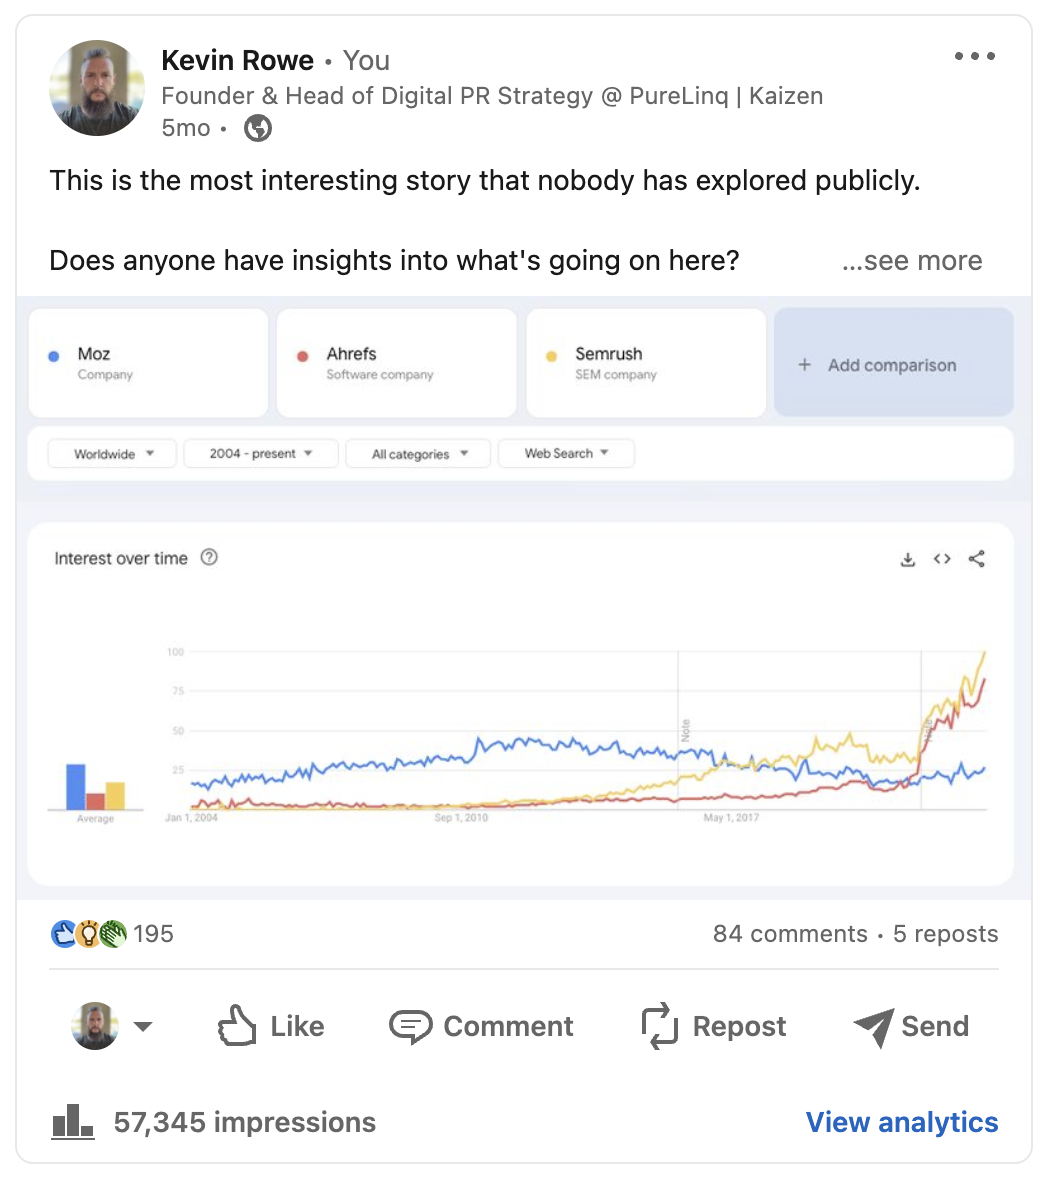 Screenshot from LinkedIn, January 2024
These numbers may seem normal for an influencer. But I’m not an influencer, nor interested in being one – I like to be the person behind the scenes making things work.
However, I am interested in unique and interesting insights, like many of you.
Valid data with strong expert commentary can uncover actionable insights that drive engagement.
Journalists and content creators understand this. This is why data campaigns work so well in digital PR and also why I use data campaigns so much.
Below, I will describe four types of data campaigns that work well to integrate digital PR and SEO. These techniques are rarely written about, if at all.
Techniques include:
Survey-first: Gather primary research from surveys of an audience to uncover insights relevant to a market segment or persona. However, the answers to the survey questions solve very specific pain points for a persona, instead of being driven by media trends. Public data visual storytelling: An analyst derives insights and provides commentary from publicly available reports, studies, data sets, or crawling the web. These insights are used as part of newsworthy stories. Market research and commentary: Experts provide helpful commentary and framing of existing or new market research. The expert point of view turns the research into actionable and helpful insights. Data newsjacking: Identify trends in data and insights that the media or others are using. Then, find data that tells a different or deeper story.Before we dive into the campaign types, take a step back and consider an overall process that turns a data campaign into more than just a link strategy, but a campaign to drive customer and journalist engagement.
Here’s a similar process to what I’ve personally used on clients like Hyatt Hotels, The Hartford, and RingCentral:
Buyer journey mapping: This is a map of the journey a buyer takes from becoming aware of a pain point to discovering solutions, buying/implementing solutions, and gaining feedback on implementation. Customers will have questions at each stage that they need answered. Media trends analysis: Analyze media trends around the buyer’s journey steps to uncover frequently unasked questions – which I call FUQs. Combine buyer and media trends: Map the trends to the buyer journey stages and identify customer questions. These questions will guide research. Data research & story design: Use the questions to guide research to uncover a data-driven storyline. Create visually interesting charts, graphs, and infographics that help journalists and content creators tell an engaging story. Find relevant pitching opportunities: Use tools like One Pitch.co, Prowly, or SparkToro to find relevant journalists or content creators. This data can be shared with op-eds, podcast appearances, journalist stories, and more. However, finding a journalist requires a lot of digging, and the right tools can uncover opportunities in less time. Pitch tests and honing: Pitching is more than a press release; it requires message testing to find a connection between the story, the journalist’s interests, and media outlet topics. According to the Muck Rack State of PR 2023, 53% of respondents said “getting journalists to respond” is a major challenge. Testing and honing help to overcome that challenge.Pat Reinhart, VP of Services at enterprise SEO software Conductor, said
“SEO now hinges on the buyer’s journey, reflecting Google’s ability to use AI in a nuanced reputation analysis.
User experiences, especially during the buying stage, are crucial for building trust and understanding. Incorporating these stories in digital PR boosts a brand’s online reputation effectively.”
So, what does a data campaign look like in the wild?
Data Campaign Examples
Data campaigns have a wide range of results.
The data can:
Be cited with a link. Include a brand or report name. Include the data and not mention the source. Share chart visuals. Link with the data as the anchor text.A data campaign will not always secure a link, but links have become less important than the entire buyer journey and experience with the brand.
Reinhart also had this to say about the importance of links and other factors in a site’s reputation:
“[links matter less now] but that doesn’t mean they aren’t still important. The way that I think about this is that in the early days of Google there were x amount of ranking factors and links was a big part of that pie.
As that pie has had more slices added to it, links have become less impactful because there are simply more factors in the algorithm.”
Let’s look at some examples.
TechRadar & Kahoot!
I reached out to my friend Juliet Travis, founder of the PR firm Liftoff Communications, for an example.
Juliet has taught me a lot about PR. So I trusted her to have a great example, and she shared some details about her campaign with the training tech giant Kahoot!.
Kahoot!’s 2023 Workplace Culture Report is a downloadable document with data on the “unique needs and ambitions” of frontline workers.
As a result of the report and PR, the report has received branded mentions of the report’s name and expert commentary from Kahoot!’s internal team.
In this example from TechRadar, the editor included the brand name and data from the training tech company Kahoot!, but didn’t include links to the report.
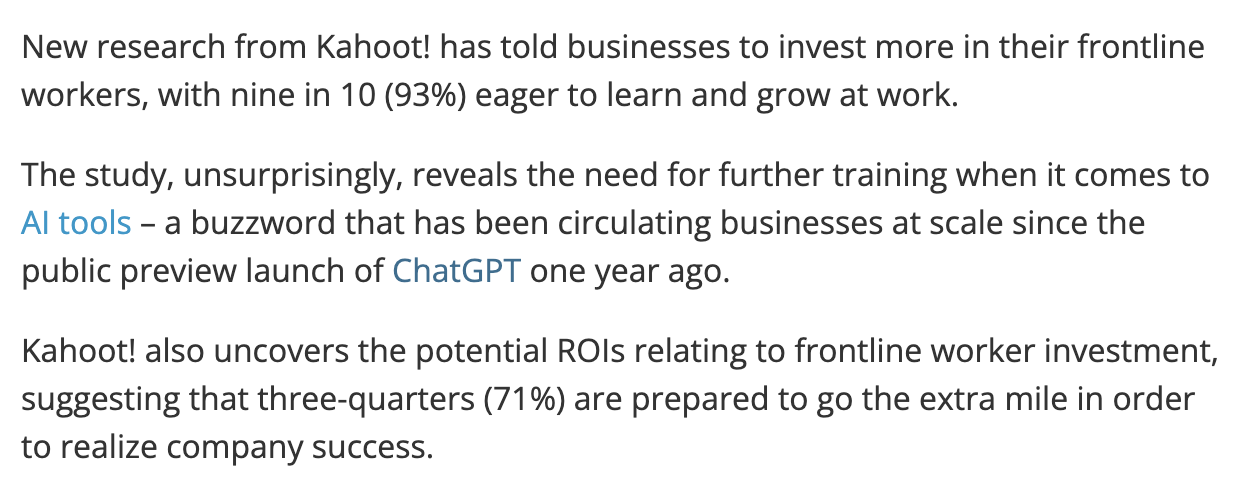 Screenshot from TechRadar, January 2024
HROtoday, in the article, Reengaging Gen Z, has another different example of the Workplace Culture Report, including a quote from Kahoot!’s Vice President James Micklethwait, but doesn’t include a link to the report.
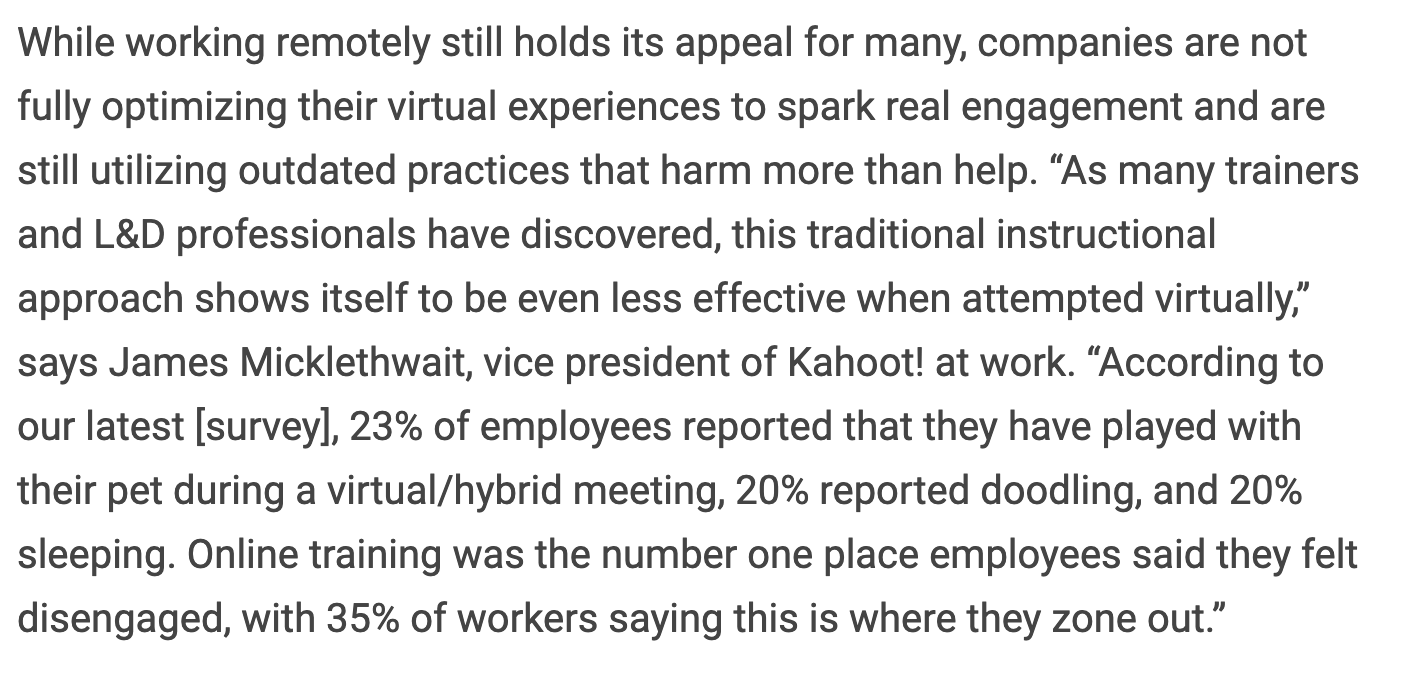 Screenshot from HROtoday, January 2024
If we’ve learned anything about Google’s AI capabilities in the last year, it’s that AI systems understand the entry or individual source from the citation and brand mentions, as well as the link.
Thus, both links and citations are part of a natural digital PR campaign.
This means the measure of a campaign’s success should include links, mentions, quotes, or citations.
Fast Company & Lillian Cotter
Fast Company Opinion Columns’ Joe Berkowitz wrote an article about how he tested the social media platform LinkedIn.
The article has a good example of data that earned a link but didn’t mention the source’s name.
 Screenshot from Fast Company, January 2024
Berkowitz cited data from Lillian Cotter, uncovering the insight that only 1% of LinkedIn users create content to highlight the importance of creating unique content.
This data was very simple and easy to compile but earned a link from one of the most difficult publications from which to earn mentions or links.
Semrush & Conductor
Conductor’s 2022 Ecommerce Playbook received a brand mention and link in Semrush’s Top 106 SEO Statistics article.
I like this example because Conductor is a competitor to Semrush is certain areas, but the blog article still included a link.
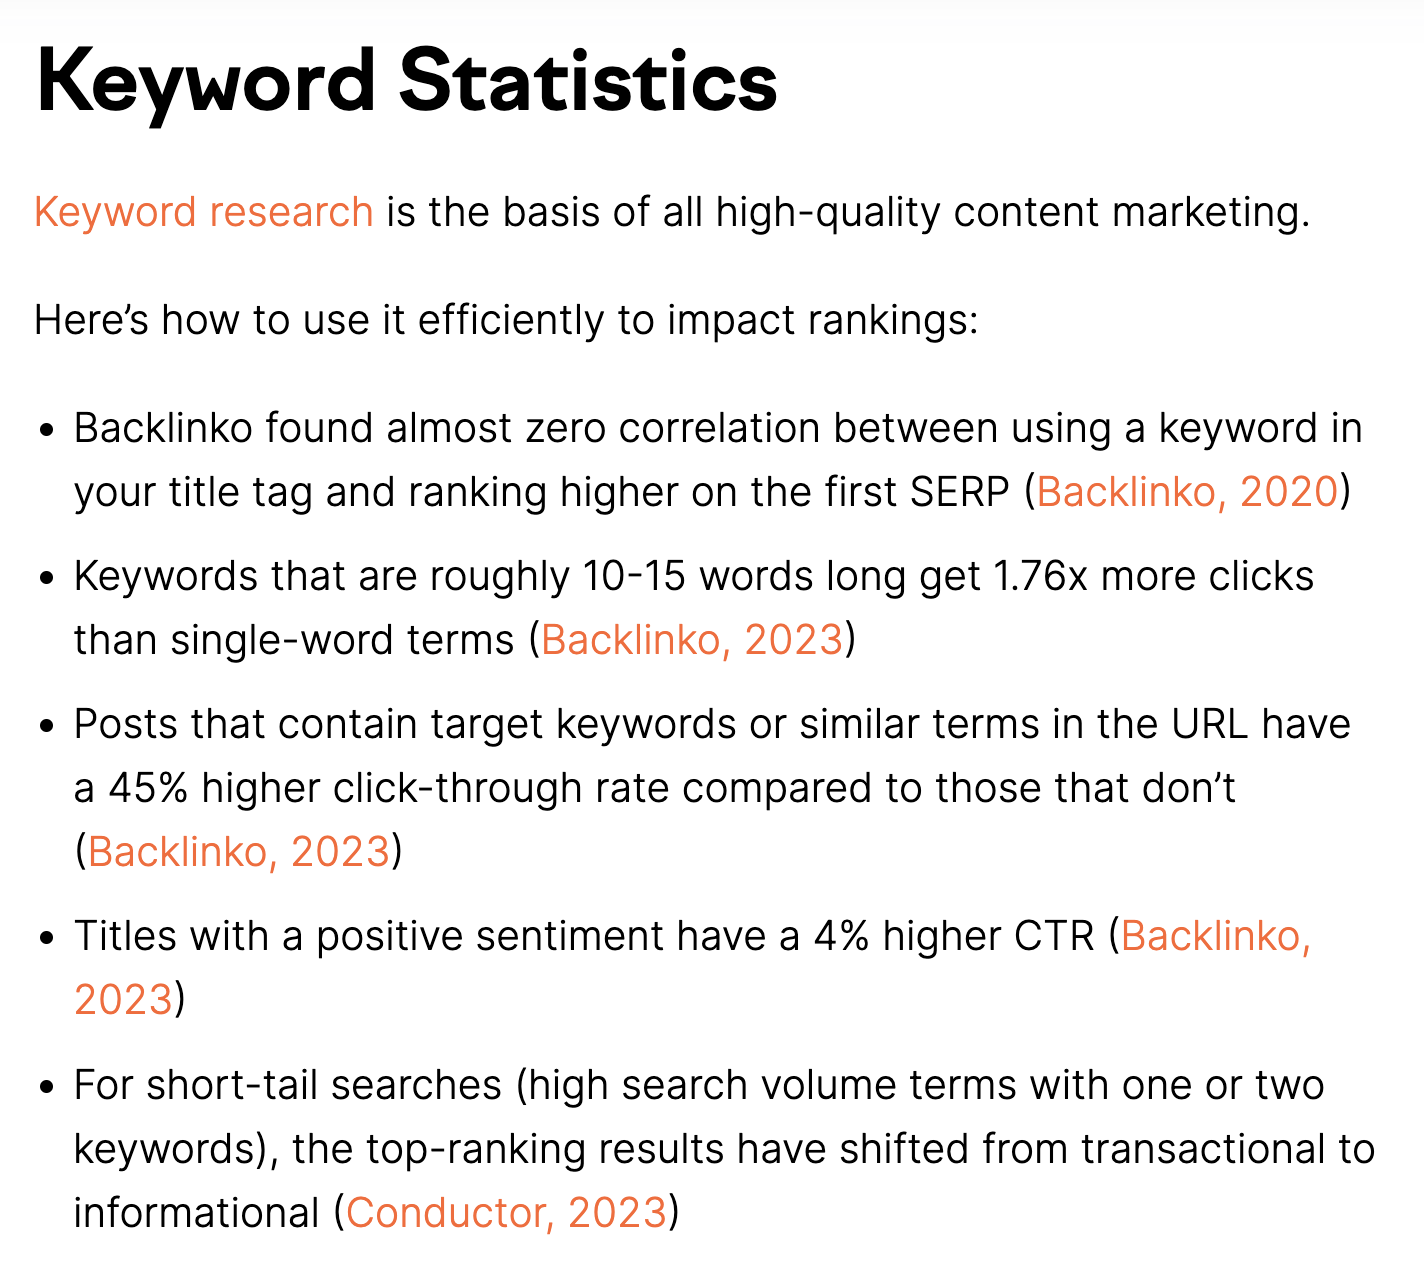 Screenshot from Semrush, January 2024
Disclaimer: In the past, my company PureLinq was a partner of Conductor’s, but not at the time of this research.
I included this example because they have always looked beyond competition to build lasting partnerships. This is why I’m not surprised that they had received a link from a competitor.
These examples show how data can earn media coverage and links. So, as you execute campaigns like the four types below, remember to take the coverage as well as the links.
Survey-First
A survey-first approach starts with a survey based on the interests of the audience and then shares it with journalists in related niches.
This method gathers original data and insights directly from the target persona or market segment. This method is in contrast to starting by analyzing media trends to gain insights related to those trends.
I like starting with uncovering insights from the audience first because it can lead to highly relevant insights about what’s important to an audience that nobody else has uncovered.
This essentially creates a whole new storyline.
This is a customer-first process:
Identify customer’s pain points: Gather data from an initial survey of your customers or monitor social communities like Reddit and LinkedIn. See what the audience’s concerns or pains are. Design survey: Design a survey to gain insights that will provide insights or solutions to the pain points. Use tools or templates like the ones from Jotform to create a survey. Survey audience: Identify an audience that can provide insights into the pain or solutions. You can create your own email lists or use a market research solution like the one from SurveyMonkey. Analyze results: Perform statistical analysis of the data to uncover valuable insights. Sometimes, simple trends over time can lead to a lot of great insights. Create visuals: Turn the data into charts for visually engaging insights. Use tools like Piktochart or Flourish to make the charts more striking than ones from Google Sheets or Excel. Media outreach: Then, create a media list of journalists or bloggers to distribute the survey. Create custom pitches based on the specific journalist’s historical content.To quickly identify audience pain points, try LinkedIn surveys or posts to see what your audience is interested in.
I create posts and surveys on LinkedIn mainly to see what topics my connections are interested in. If the post’s topic gains engagement or a strong discussion, then I’ll consider turning that into a survey.
Furthermore, based on the audience profile that engages with the posts, you can determine the type of audience that will be interested in that content type or angle.
For example, I ran a brief and simple survey on LinkedIn to understand if Ahrefs’ price increases were a concern or pain point for SEO pros.
The results showed that the majority of respondents were unhappy about the price increase.
Due to only having 67 votes, this survey isn’t valid to gain meaningful insights into what Ahrefs’ large customer base really feels about the price change.
This survey doesn’t explore that Ahrefs is still considered, by many, to be significantly faster with more useful data points than Semrush for link analysis, media research, and reporting use cases.
And the Ahrefs dataset is much larger than majestic.com, which has a comparable user interface.
However, a survey like this does show an interest in this subject and thus a topic to perform a more robust survey. The posts about the survey received over 11,000 impressions, almost 70 likes, 89 comments, and three reposts.
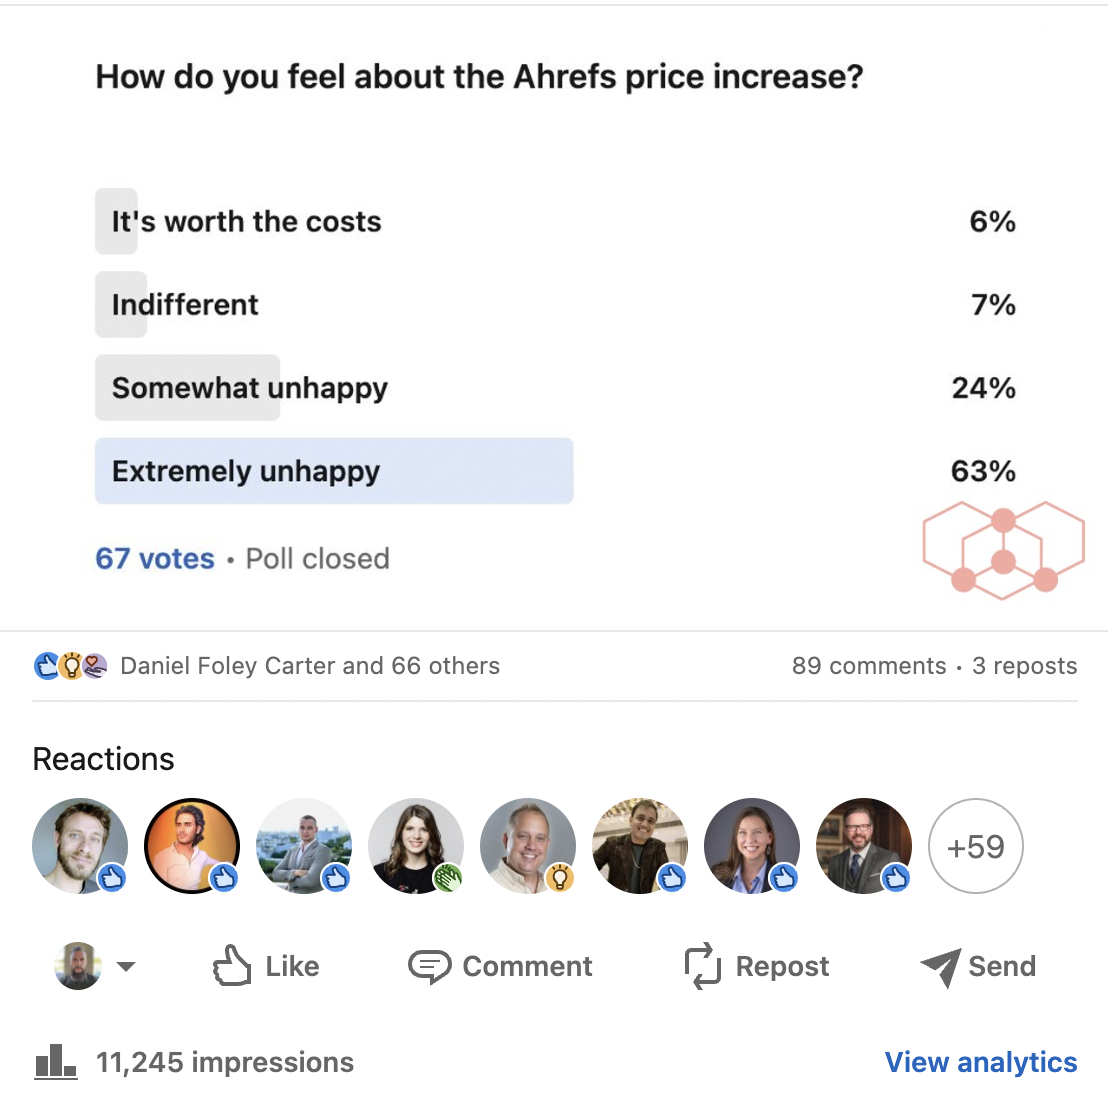 Screenshot from LinkedIn, January 2024
Visual Storytelling With Public Data
This method visualizes publicly available data to find trends or relationships between data points that haven’t previously been explored.
Then, that data is turned into a graphic chart, graph, table, or infographic to pitch to the media. An internal expert will provide framing commentary to explain the relevance of the data in the context of a newsworthy storyline.
If you’re not a great storyteller, listen to Loren Bakers’ podcast with Ryan Kutscher about content & brand storytelling.
Kutscher mentioned the idea of ikigai, which is about finding your true purpose and passion. He suggested that to tell a great story, you have to be passionate about the topic.
Data campaigns are much like this. Find topics that internal experts are passionate about to ensure the data is compelling.
When crafting a visual story from public data or any research project, the process can be very simple:
Start with a question or single true fact: In the book, “Hemingway on Writing,” Hemingway said, “All you have to do is write one true sentence. Write the truest sentence that you know.” Gather and analyze relevant data: Use data sources like kaggle.com, Google Dataset Search, or data.gov to find raw datasets that you can have an analyst analyze. Create a data-driven storyline: Create a narrative based on insights from the data, but not about the data. The data shouldn’t be the center of attention but solidify the main points. Design & optimize visuals: Use tools like flourish.studios to create simple charts and graphs. But for really amazing pieces, find a designer that specializes in data storytelling.Pro tip: Journalists may strip out links, branding, or source info. Create indispensable commentary from an expert who is a great fit for the subject matter they are commenting on.
If the source or graphics are removed, the commentary will stay with a mention of the brand.
Market Research & Analyst Commentary
Using existing research with analyst commentary is a strategic approach that gathers and analyzes information about a specific market.
The details can include size, growth, trends, competitive landscape, or buyer behaviors.
An expert will frame the insights from this research with expert commentary. The data and commentary can be used by journalists to create content or explain concepts to an audience.
Define objectives and questions: Research and commentary should answer audience questions. What do you want to understand about a market? What questions are potential customers asking? What pain points does your persona have? Collect data: Find existing reports or sources of raw data. Sources can include industry reports, SWOT analysis, market segmentation, market forecasts, trend reports, etc. Analyze data: An analyst will use existing reports and data to create charts and graphs and then analyze the data for insights. Synthesize findings: Develop a list of key insights derived across all data points. Look for impact in the findings. Commentary: Use an industry expert to comment on the research and insights. This should provide a unique perspective that adds value for the reader. An expert can take data or information and turn it into actionable insights.Pro tips:
Try searching Google for “{keyword} intitle:{report type}.” For example, to find an SEO industry report, search for “SEO intitle:industry report.” The expert commentary and insights should frame the data in ways that a specific person can take action — a person in a role that has a specific problem or interest.Data Newsjacking
Data newsjacking in digital PR is a technique that involves analyzing current news stories or topic trends and then performing primary or secondary research to create a storyline from data or statistics.
Find stories with existing data, then uncover data-driven insights that contradict or complement the original data.
This method attaches your brand or expertise to trending stories but also provides valuable data that journalists can use to help tell their story.
The process for this is:
Monitoring trending news: Ongoing scanning and monitoring of the news for breaking stories or popular discussions that are relevant to your industry and expertise. Use Google Alerts or BuzzSumo to find trends. Tools like Google Trends or MarketMuse have trends that are good for general direction but not specific enough. Gather data: Use industry reports, surveys, or other credible sources around the topic. The data must add value to the story. Create a storyline: Turn the data into a storyline with supporting graphics to make the data more digestible. Commentary: Have experts provide commentary that turns the data into actionable insightsThis technique can use both primary or secondary data – however, secondary data is much faster to gather and analyze.
Conclusion
Digital PR for SEO is a big shift from traditional link building strategies, focusing on audience engagement and trust-building through content and expertise sharing.
It’s more than just a game to find links; it combines data-driven campaigns, insightful storytelling, and strategic media outreach to create meaningful interactions with audiences and journalists.
The key takeaway here is clear: Successfully integrating SEO and PR is about creating value through data-driven insights and storytelling that resonate with both customers and the media.
The links, brand mentions, quotes, and citations are as important now as link profiles were five years ago.
More resources:
7 Link Building Tips For Beginners 7 Steps To Building A Kickass Digital PR Campaign Link Building for SEO: A Complete GuideFeatured Image: zoomonpictures.it/Shutterstock

 JaneWalter


