Beginner’s Guide to Content Marketing Reporting
In this guide, you’ll learn the three best practices of reporting and eight types of information that make a solid content report, including the actual KPIs used by content marketers. From my experience, I’ve learned that having three key...
 BigThink
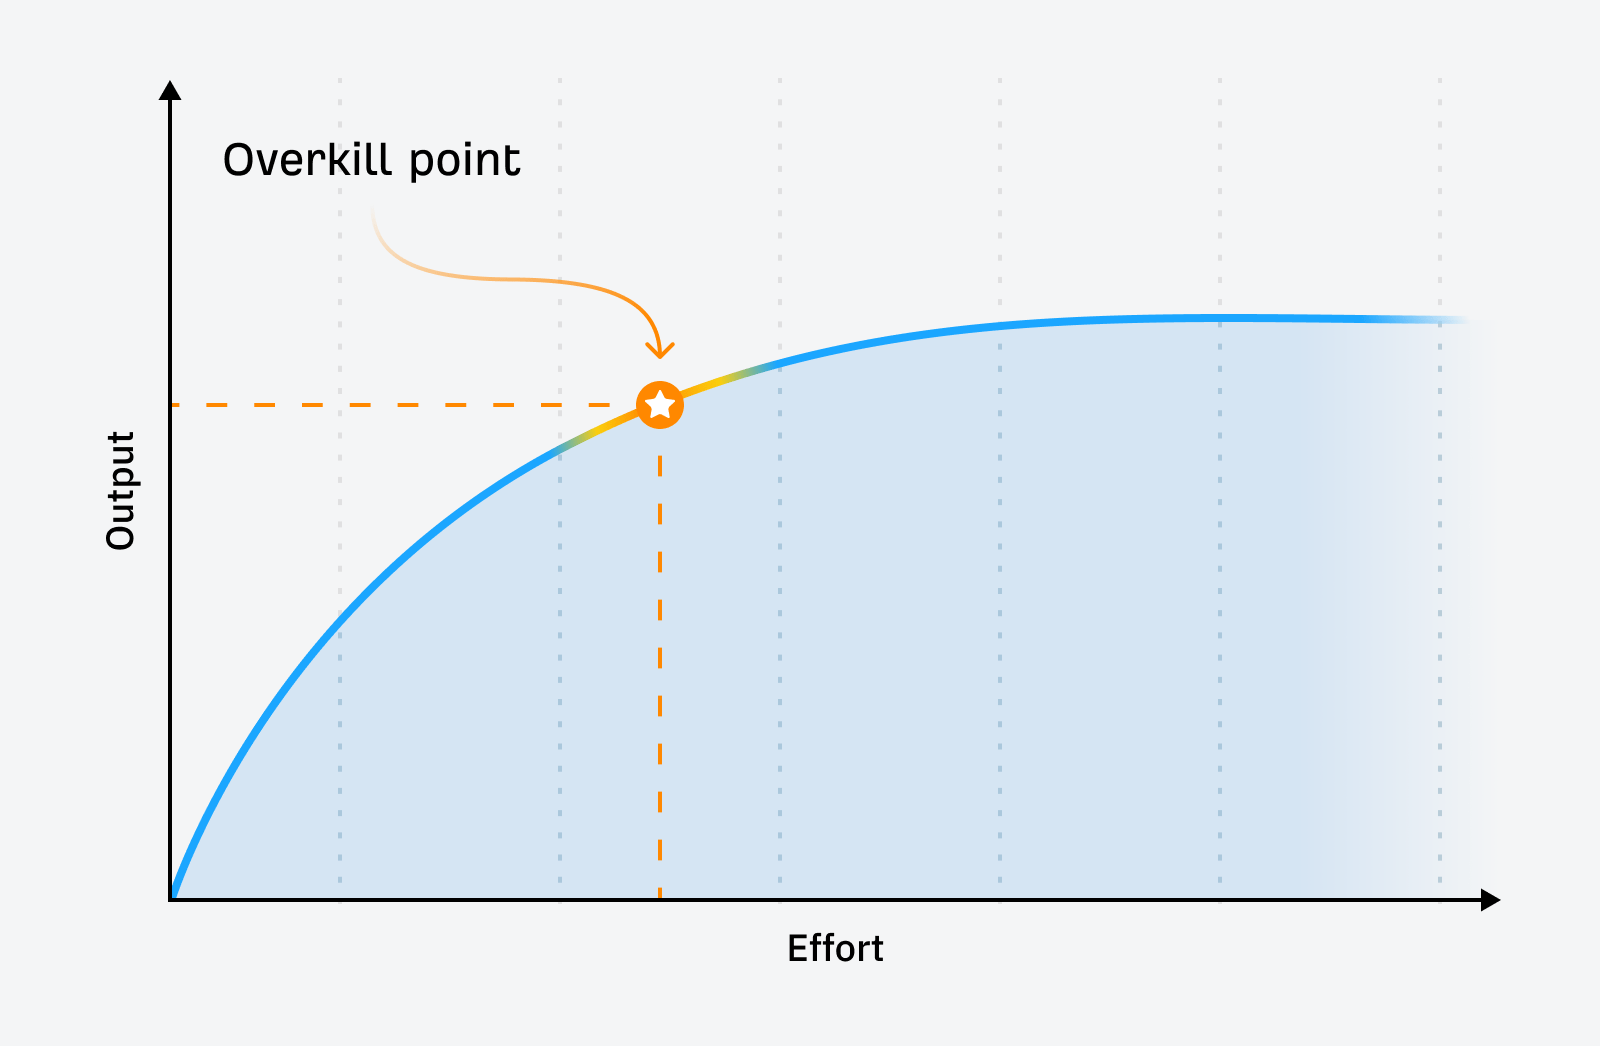
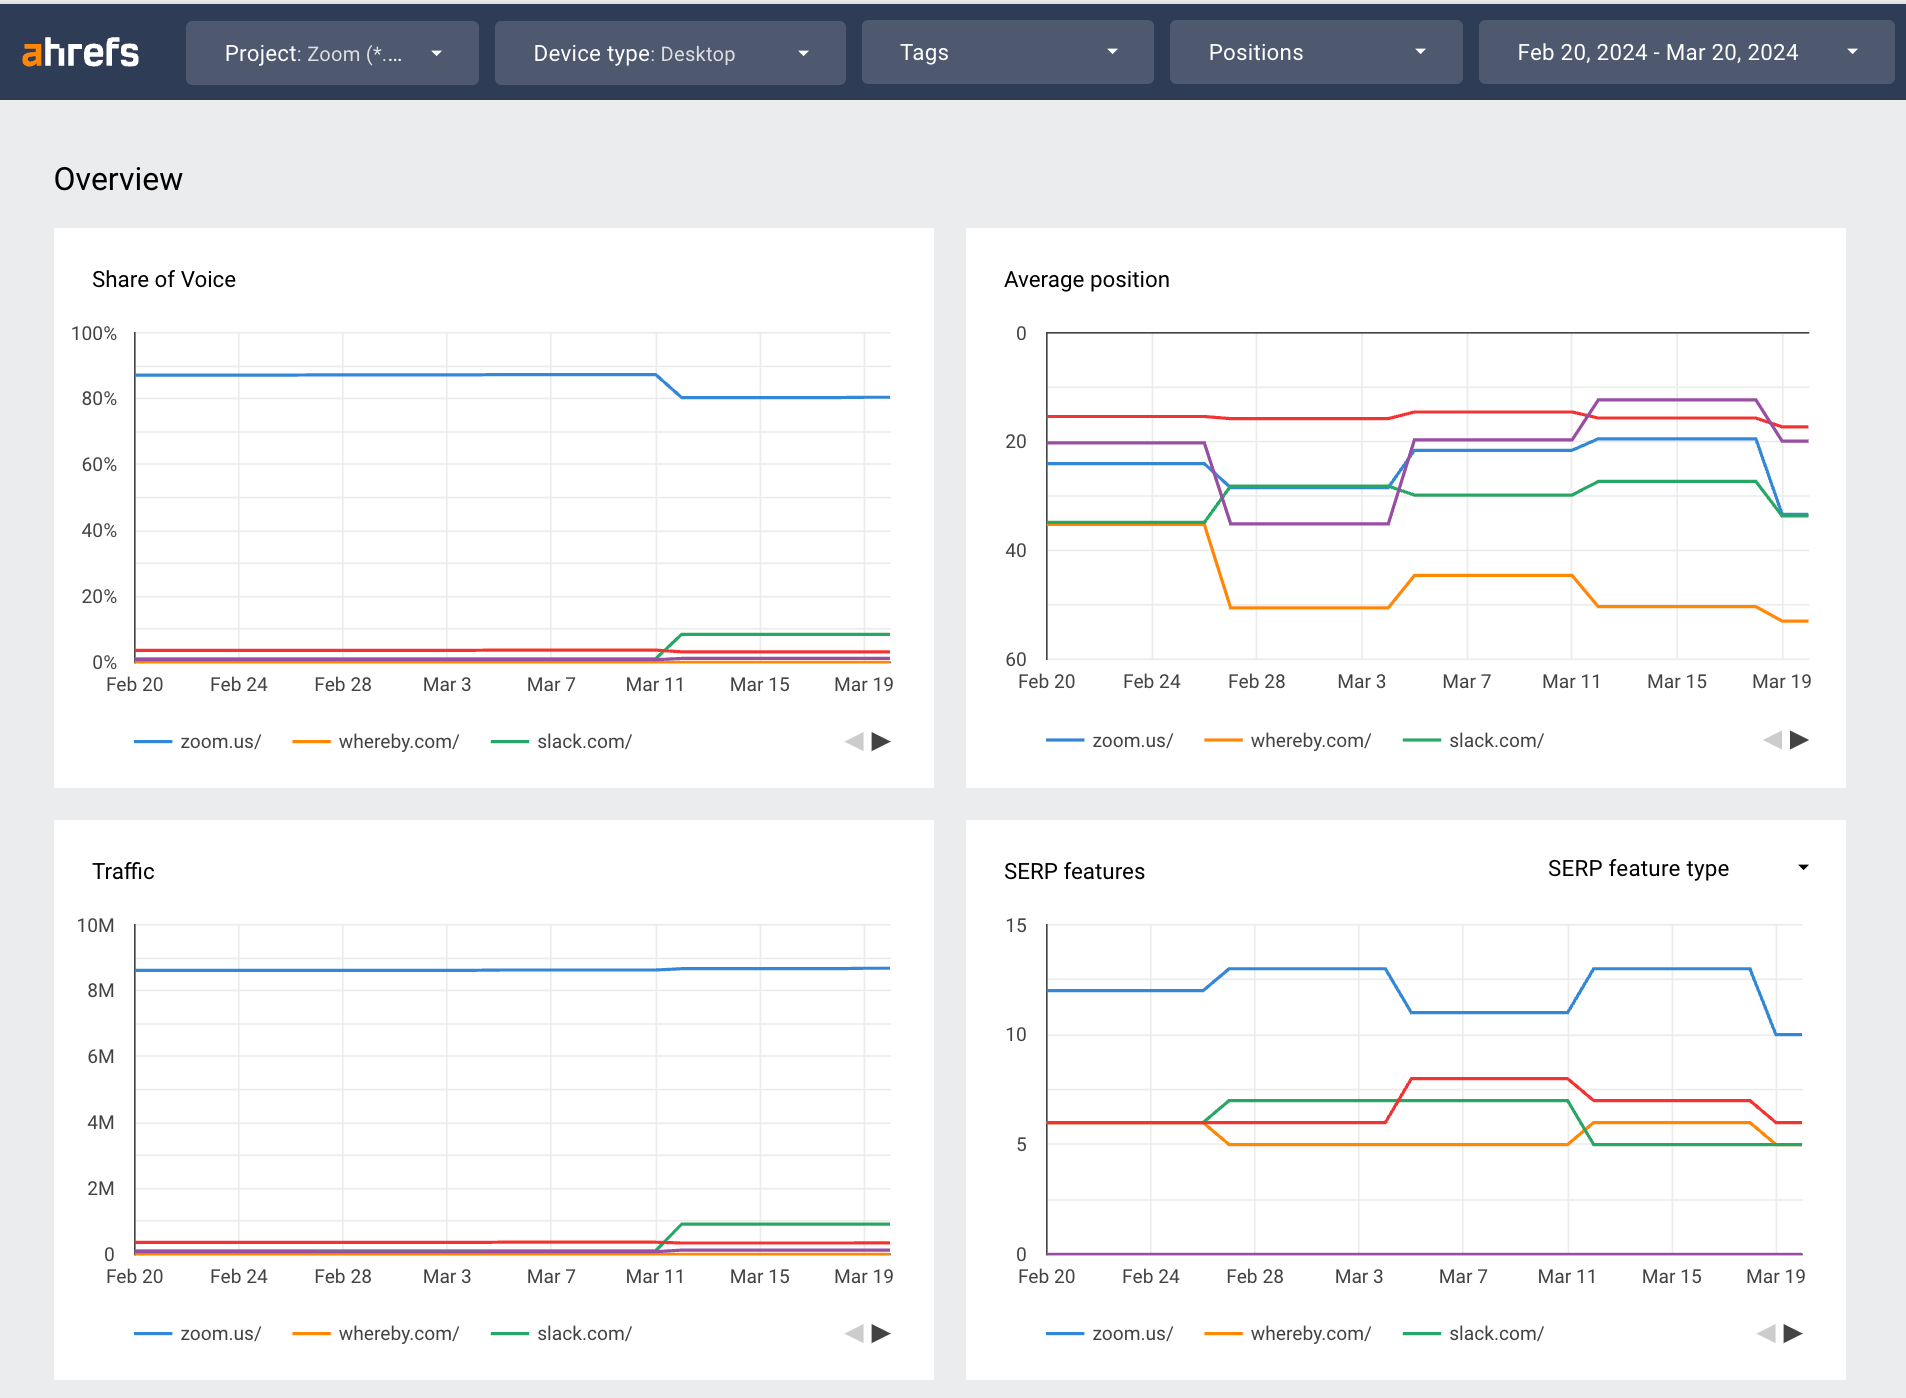
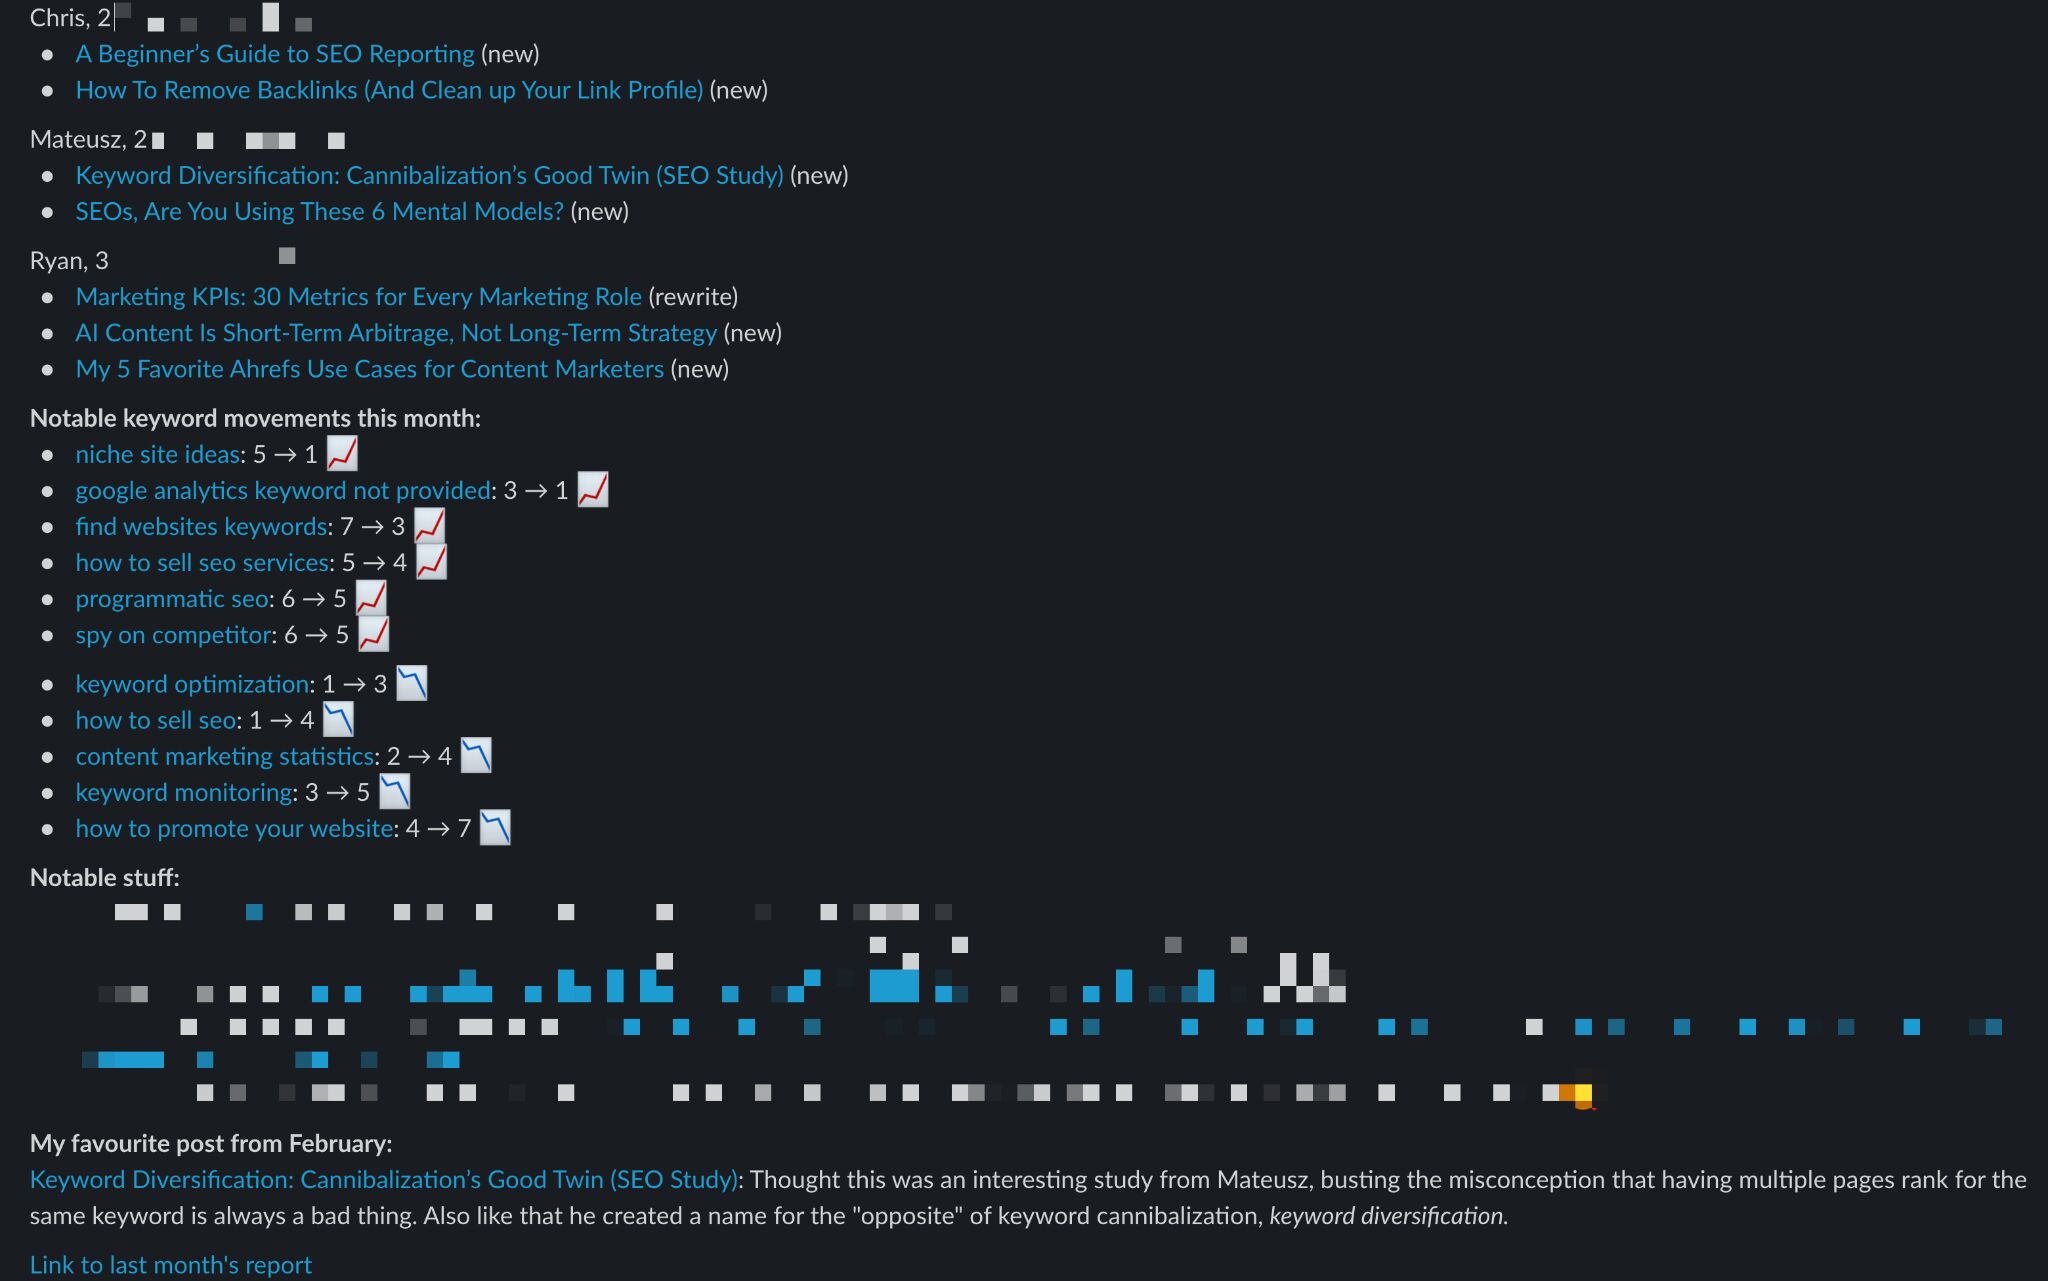
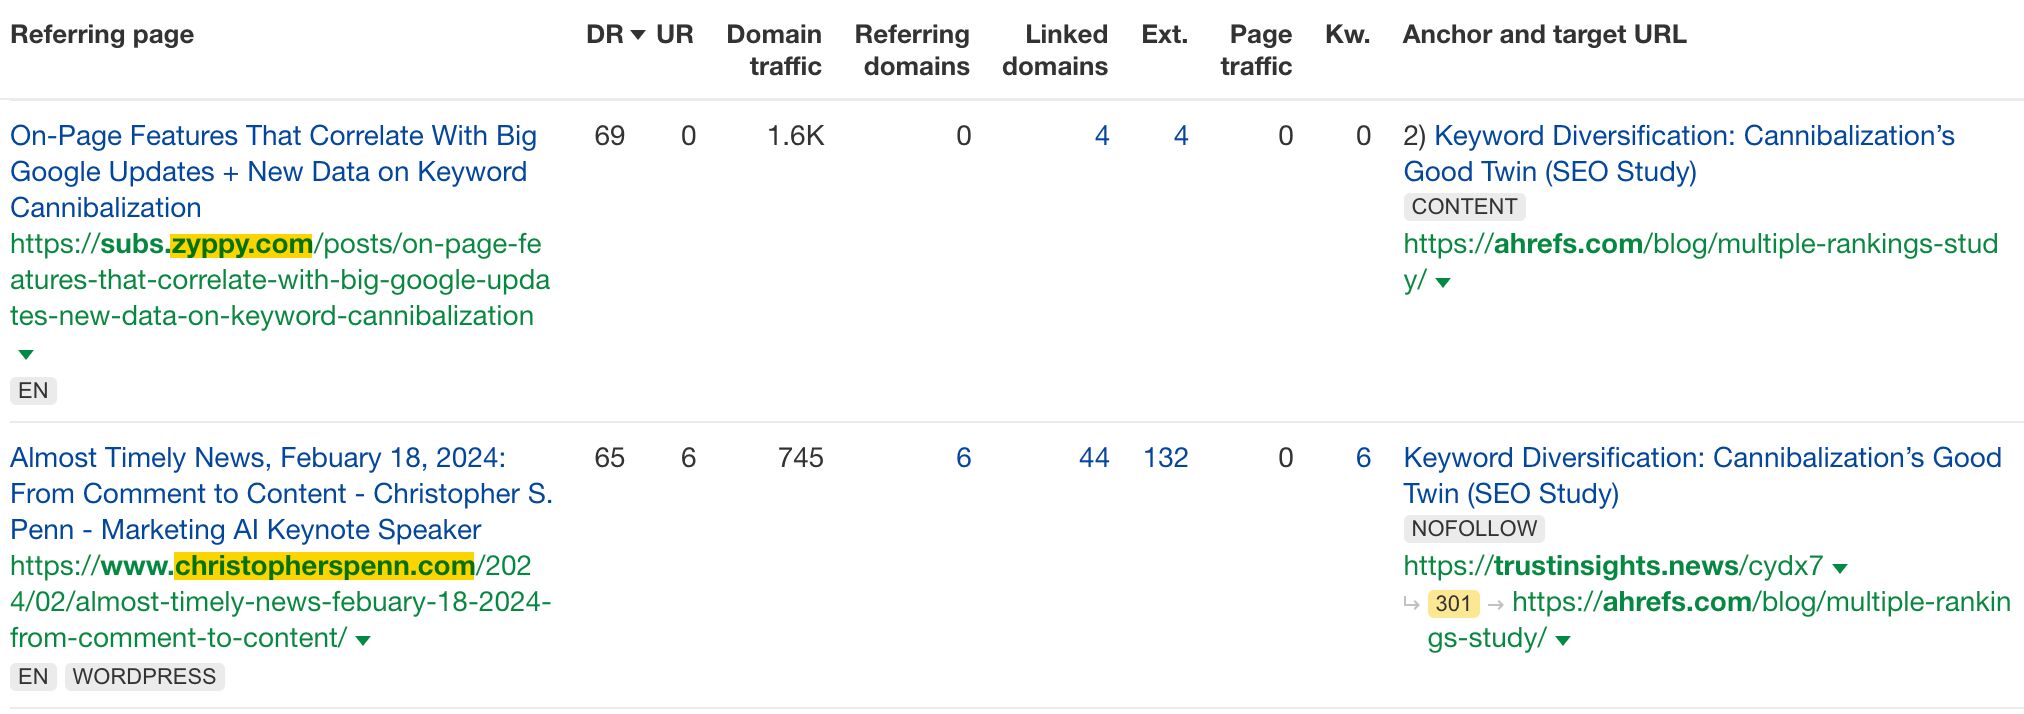
Not sure how to prepare your content report? I get it — too many metrics to report, and what should a report look look in the first place? I promise this will change by the end of this guide. In this guide, you’ll learn the three best practices of reporting and eight types of information that make a solid content report, including the actual KPIs used by content marketers. From my experience, I’ve learned that having three key features in a content report makes all the difference: data-led, actionable, and function-driven. It keeps everyone on the same page and ensures our work counts. Let’s unpack this. Instead of relying on gut feelings or assumptions, a data-led report is based on quantitative (numbers) and qualitative (observations) data to provide a clear, objective view of content performance. This way, every recommendation or insight is grounded in verifiable facts, making it a reliable tool for decision-making. At the same time, a good content marketing report doesn’t just drown the reader in numbers and charts; it interprets the data to provide clear, actionable insights. This means specific recommendations accompany the numbers on what can be done to improve performance. Whether it’s tweaking the content strategy, focusing on different topics, adjusting distribution channels, or choosing different SEO tactics, actionable reports transform data into a roadmap for better outcomes. In reporting, form needs to follow function — the content and structure of the report need to be tailored to the specific needs of the person you want to share it with. You could also think of it this way: reports should be good enough to serve their purpose, but everything above that would be overkill. Don’t overthink, overcomplicate, or over-design your reports. Pick the KPIs that you can actually influence, add some actually useful commentary, and choose the form that won’t make your boss or client think that you’re spending too much time on “paperwork”. To illustrate, a typical agency or freelance report is about ROI or generating value for the client. They come in the form of an entire document, nicely designed with a lot of data and insights (similar to this SEO report). It could even be accompanied by a live dashboard like the one below created in Google Looker Studio: On the other hand, in-house reports are typically about documenting performance and progress. They are much more streamlined. For example, the monthly blog report at Ahrefs is a short, public message on Slack with three types of information: the number of published articles, notable keyword movements, and any notable stuff. That’s it. In this part of the guide, we’re discussing content marketing KPIs and qualitative feedback that will allow you to build a solid report. These are based on our poll on metrics actually used by marketers and a few tried and tested suggestions from us. Keep in mind that your final metrics may differ depending on your strategy. We encourage you to customize your reports. Summaries are designed for stakeholders who just want to know the most important points. They may not have the time or the interest to dive into data and put together an overall picture of your performance. These people will be expecting something like this: It’s a good practice to add summaries at all times, but you’ll find them especially useful in large teams and when working with clients. Summaries are put in the front of the report but written last. Don’t write them before collecting and analyzing the data. This section details the quantity and type of content published within a specific timeframe. This will tell your boss or client how efficient you/your team is. It can include blog posts, videos, podcasts, infographics, and social media posts. You can simply measure the volume of content produced and categorize it by type to assess productivity and diversity in your content strategy. Traffic shows how good the content is at attracting clicks to the website. Typically, stakeholders want to know the growth of traffic rather than just the number of clicks in a given period. A thousand more clicks in a month may be exceptional for one website but a poor result for another. It’s also a good idea to break down traffic growth by: Traffic is easy to measure. Free tools such as Google Analytics or Matomo should be enough. For organic traffic from Google, make sure you use Google Search Console, though. Tip Google Search Console will give you the most accurate organic click data, but SEO tools like Ahrefs will give you the means to improve it. For example, you can see how a site stacks up against competitors (and break down their strategy) or see which pages gained and lost the most traffic in a given period. For traffic reporting, you will also find Ahrefs’ Portofilos feature helpful. You can track organic traffic and other SEO metrics for any collection of pages. For instance, a set of your client’s websites, competitors, or all content directories. SEO (search engine optimization) metrics help you understand the visibility and ranking of your content in search engines. There is a variety of metrics you could report here, but according to our insights, marketers usually report these: You’ll need two types of tools to report these metrics: Google Search Console for organic traffic (i.e., clicks) and impressions and an SEO tool like Ahrefs for everything else. If you feel that the recipient of the report will be interested in top-level metrics only, consider reporting just the share of voice and organic traffic. The benefits of being visible in Google are obvious even for non-marketers, so you’ll send a clear and strong message if you prove with these metrics that your content makes the brand stand out in Google, and because of that, you’re able to attract more visitors. On the other hand, if your audience is SEO-savvy and that channel is a big part of your strategy, you can make your report shine with additional metrics explained in this guide to SEO reporting. This measures the increase in your content’s audience over time, including new subscribers to newsletters, video/podcast channels, and social media followers. Tracking these metrics helps assess the effectiveness of your content in attracting and retaining a growing audience. In other words, audience growth shows the demand for more content like the one you’re already making. For example, at Ahrefs, we track the subscriber growth on AhrefsTV YouTube channel, and we simply use YouTube’s native metrics for that. Engagement metrics gauge how actively your audience interacts with your content. Here are some common engagement metrics tracked by marketers: It’s almost never bad if you get high numbers on those metrics. In an ideal world, they indicate that people really enjoy your content, but in reality, these metrics are quite nuanced. For example, some types of content are less likely to get likes on social media, and a short time on page may mean that people found what they wanted and left immediately. Therefore, it may be best to use engagement metrics in the right context. Conversion metrics measure how effectively your content prompts users to take a desired action, such as signing up for a free trial. Examples: Leads, downloads, and even revenue vs. traffic correlations are quite easy to track (and prove). Most tools that allow you to create a lead capture form will have built-in analytics, while esoteric data analysis stuff like correlation can be handled by ChatGPT in a breeze these days. But if you want to prove that a specific piece of content generated X number of sales or Y amount of monthly recurring revenue, that’s going to be tricky. Essentially, you’ll be trying to prove the ROI of content marketing — something everybody wants to know, but nobody can really prove without using the word “probably”. It’s very likely that the people who will read your report, or even yourself, might like to know the “return on investment”, so let’s stop here for a brief moment. The problem with ROI in content marketing lies within imperfect attribution models and non-linear customer journeys. Ryan Law explains it in his guide to calculating content ROI: Did someone convert because of an article or in spite of it? When they read multiple articles, which had the biggest impact? If someone buys because of an advert, should we still credit the blog post they read beforehand? Customer journeys are also rarely as straightforward as we’d hope. One person might read 50 articles and never buy anything; another might read a single article, disappear for a year, and immediately buy. What role did content play in those journeys? That said, the ROI of content is not a topic you should avoid. You basically have two choices here: Finally, finish your report with anything worth mentioning that goes beyond raw data or beyond the ordinary. These could be: For example, I use Ahrefs every month to find sites featuring my articles. This example shows two industry influencers linking to my recent SEO study. This is also a good opportunity to mention operational feedback: No report can be effective without support from stakeholders. Rather than insisting on a specific report format, show a sample of the report, explain the value of it, and ask for feedback. You’re the expert, but they’re the client, so be open to finding a middle ground. As for reporting frequency, the norm is monthly, quarterly, and annually. Additionally, reports may be prepared for specific campaigns, which can vary in duration. Again, this is something worth discussing with the recipient of the report.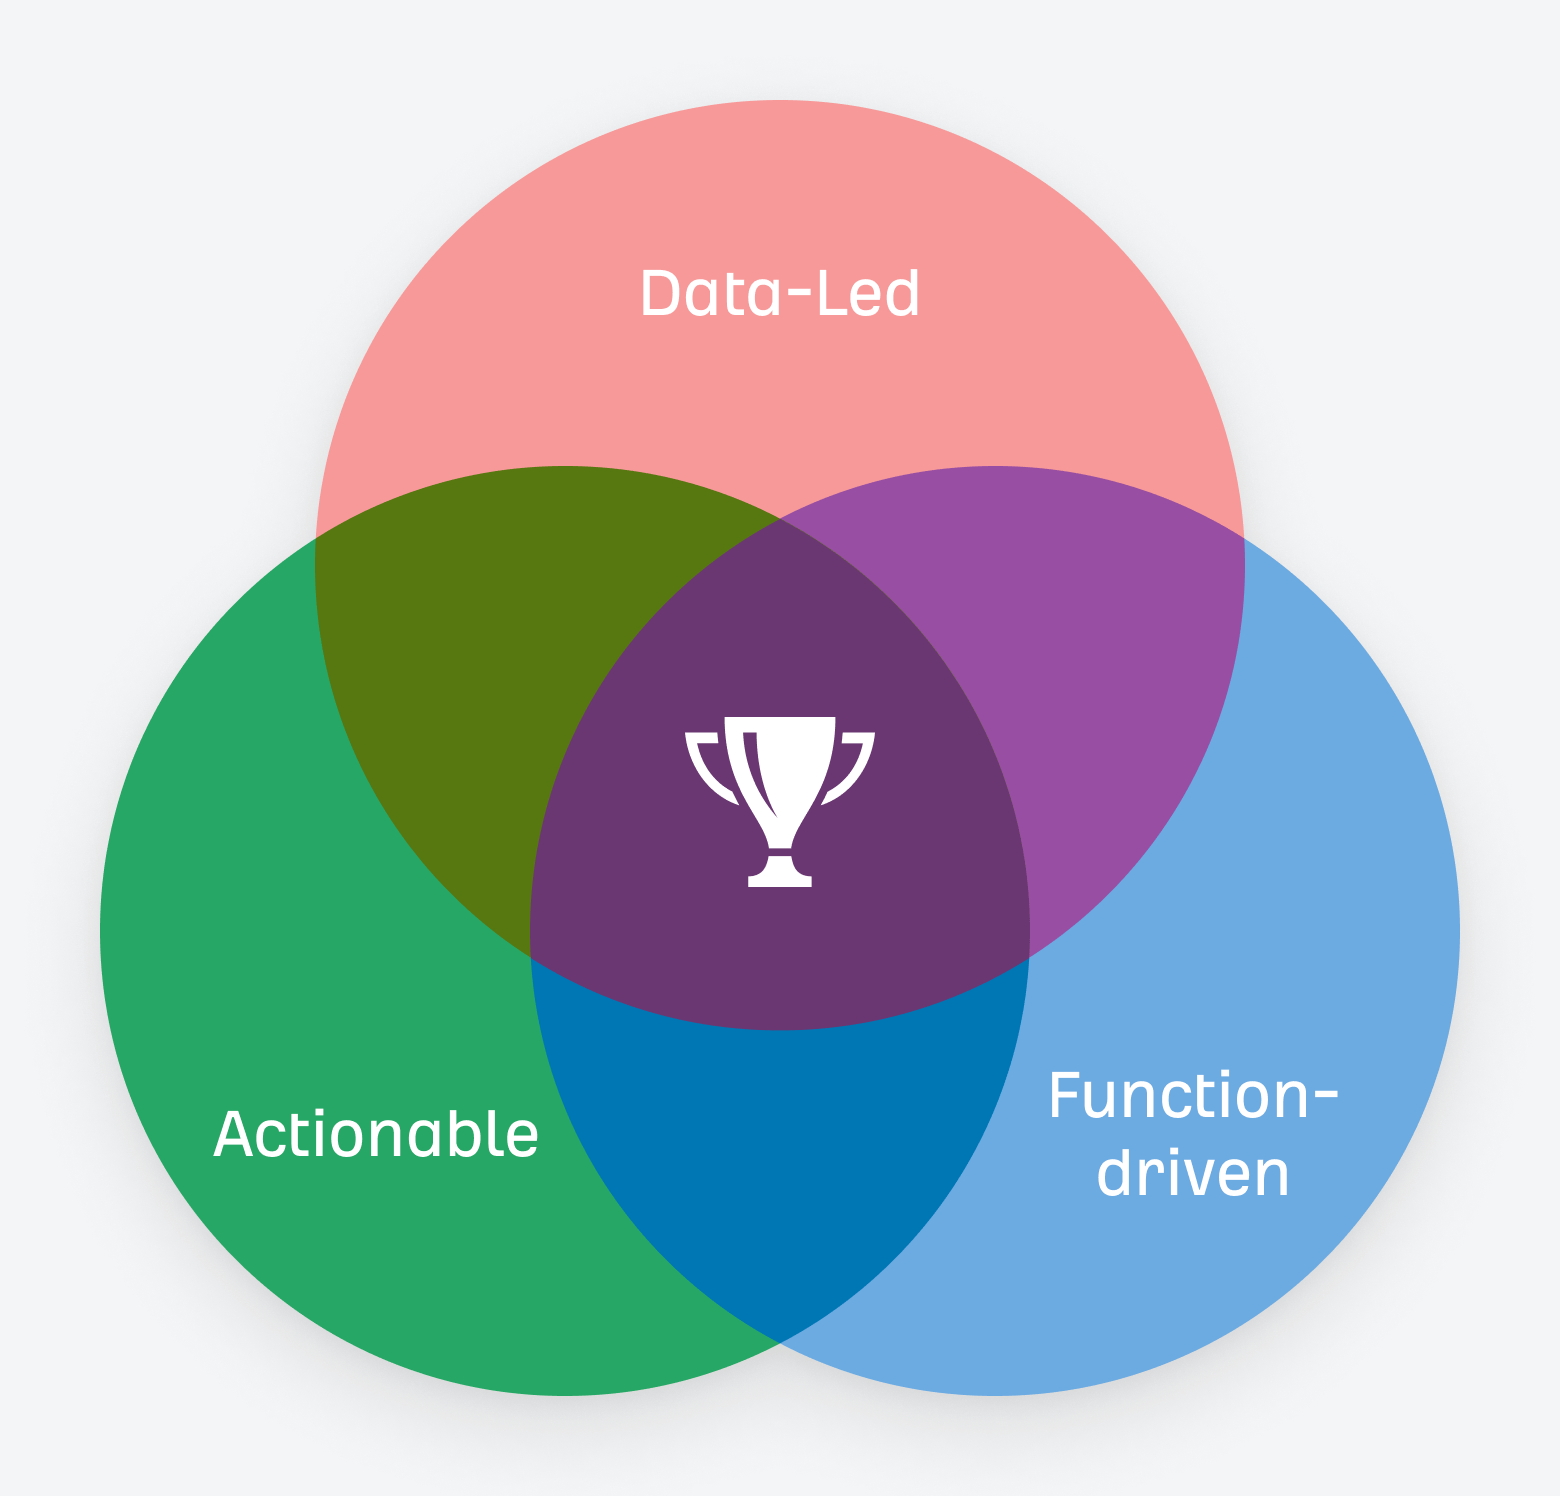
1. Data-led
2. Actionable
3. Function-driven
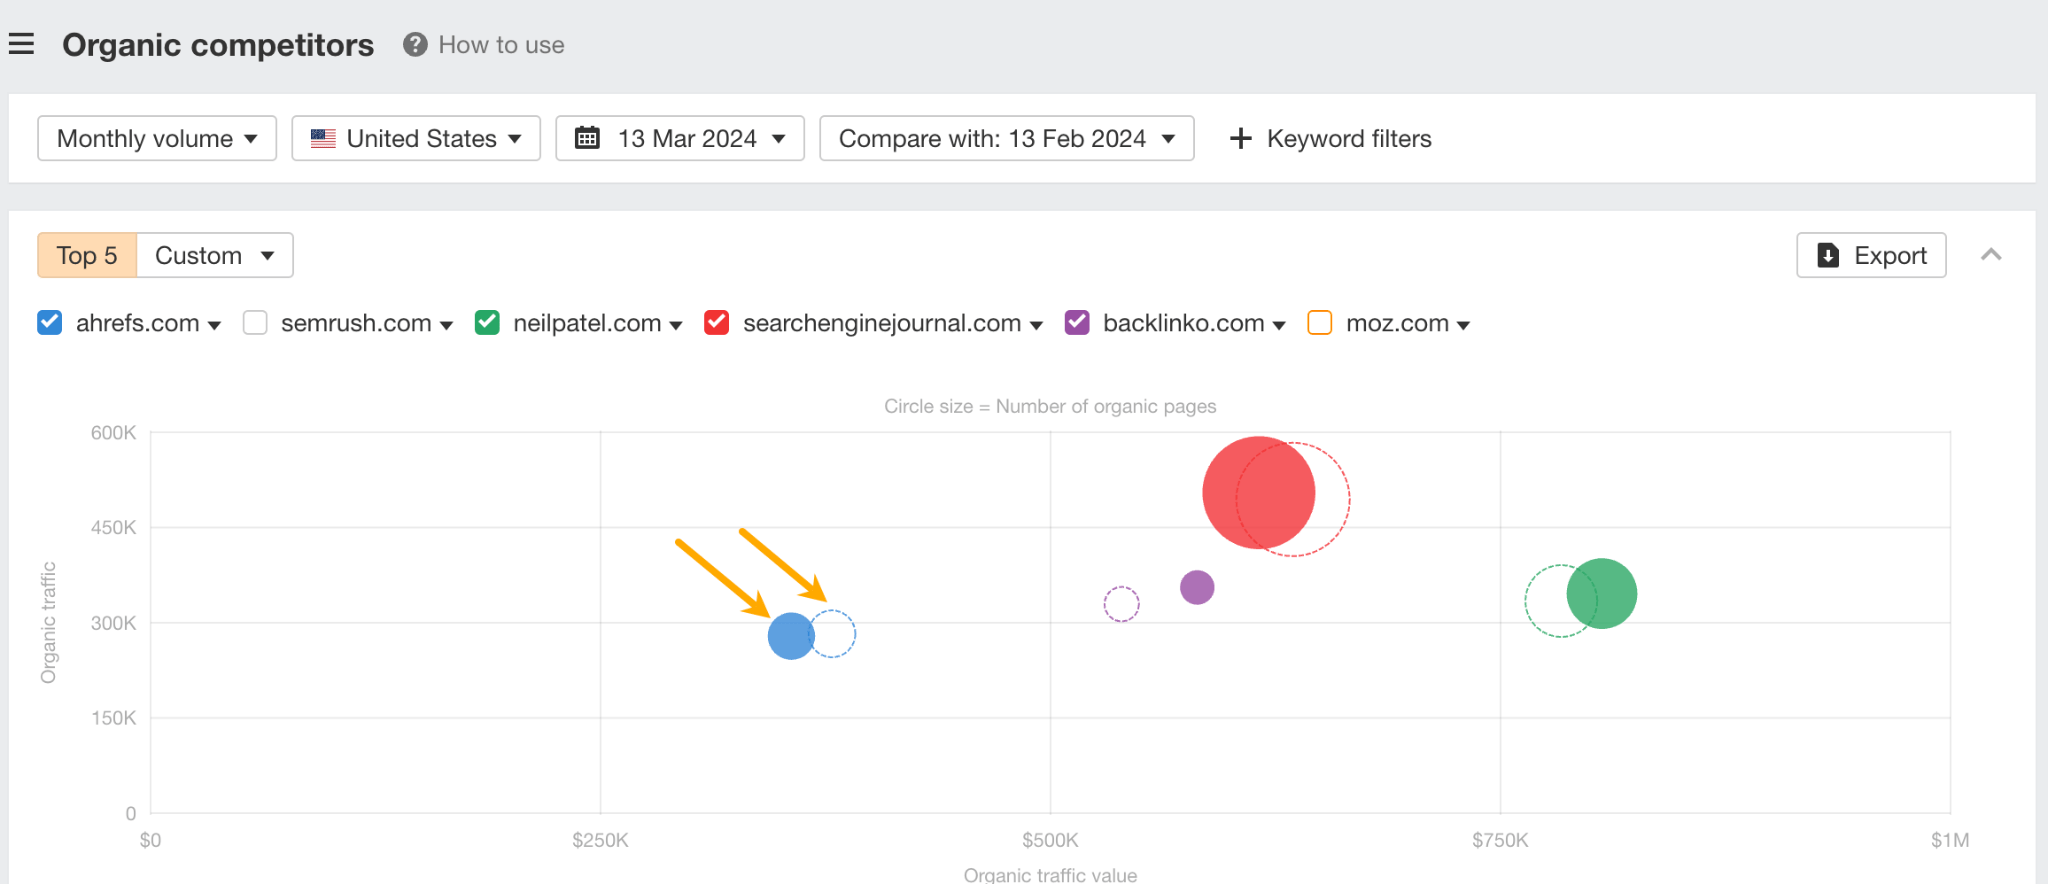 Organic competitors report in Ahrefs showing a month-to-month performance change.
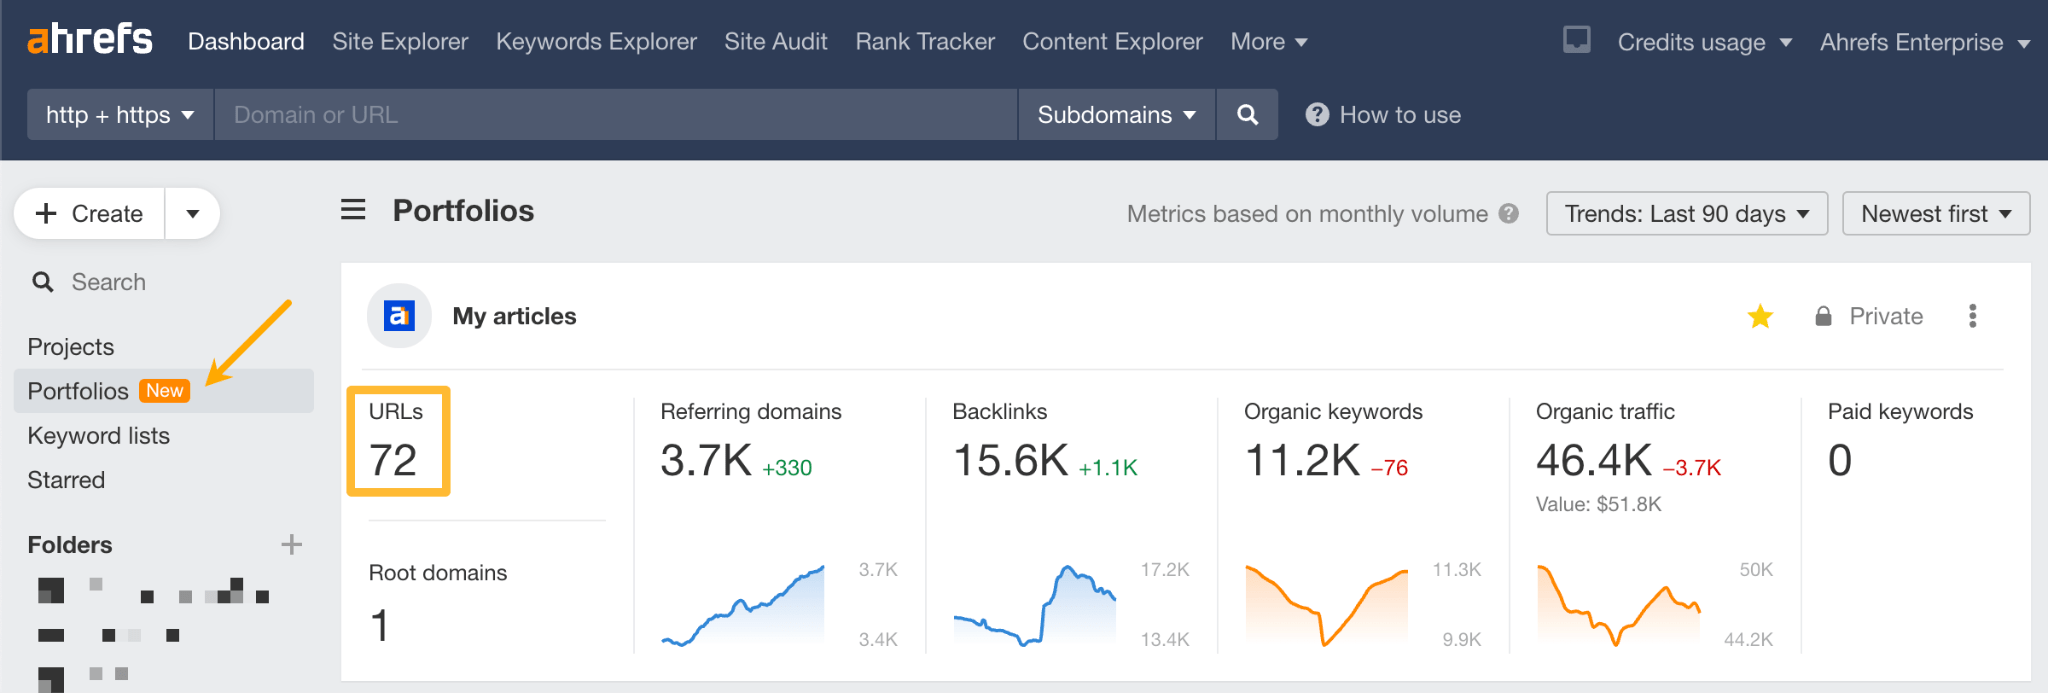
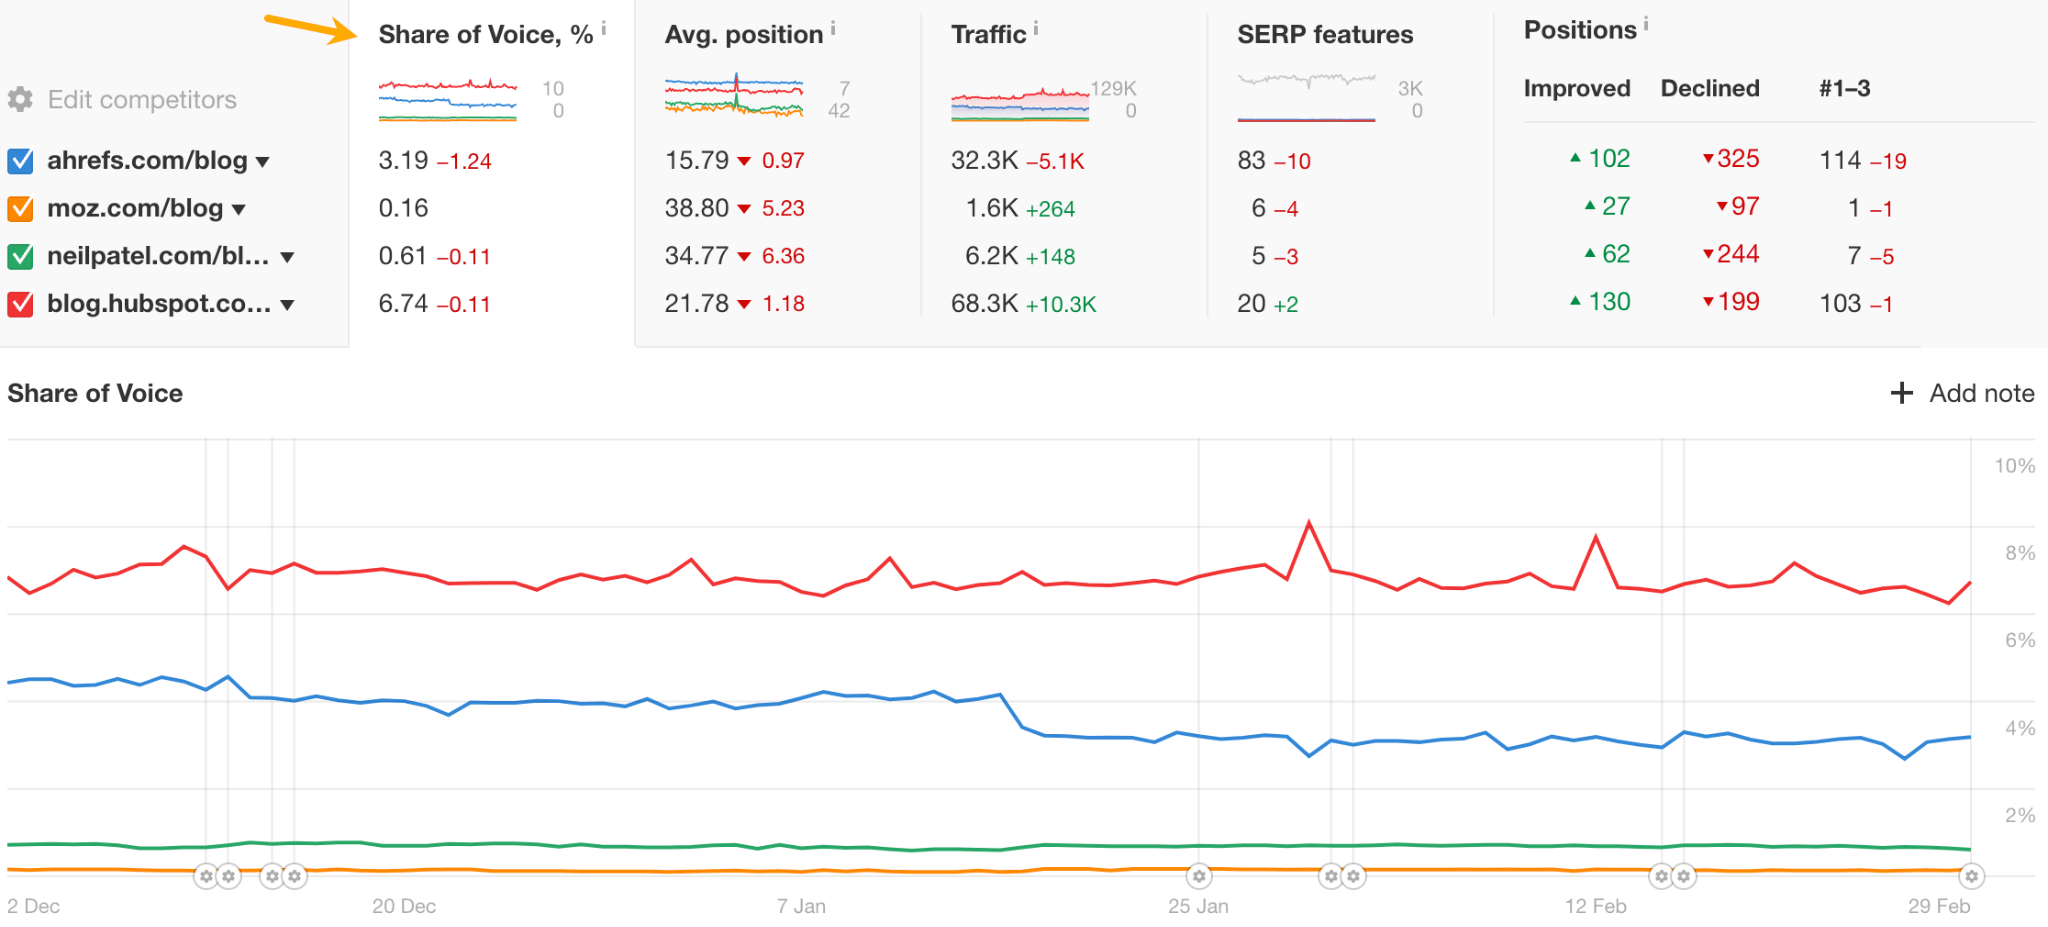 You can find the share of voice metric in Ahrefs’ Rank Tracker.
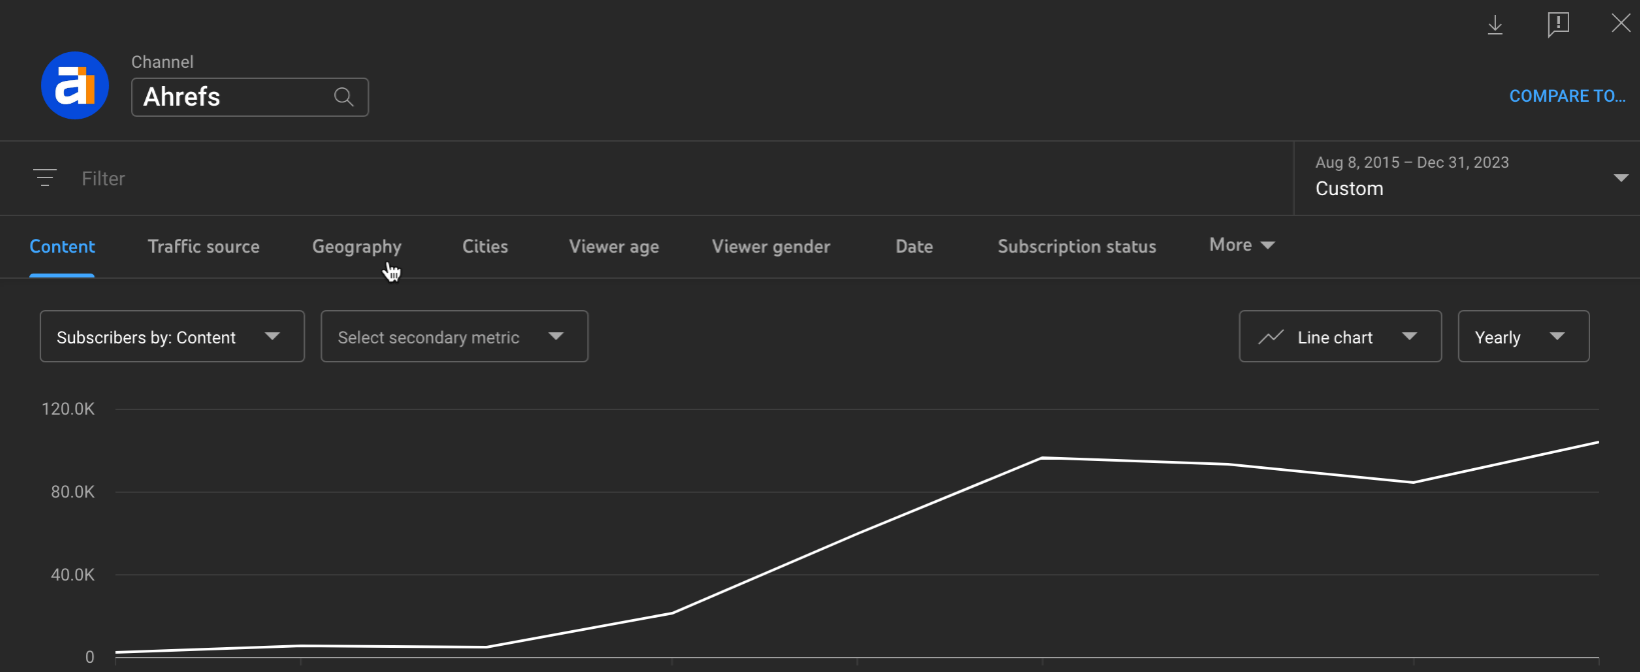 An actual screenshot of our YouTube channel audience growth.
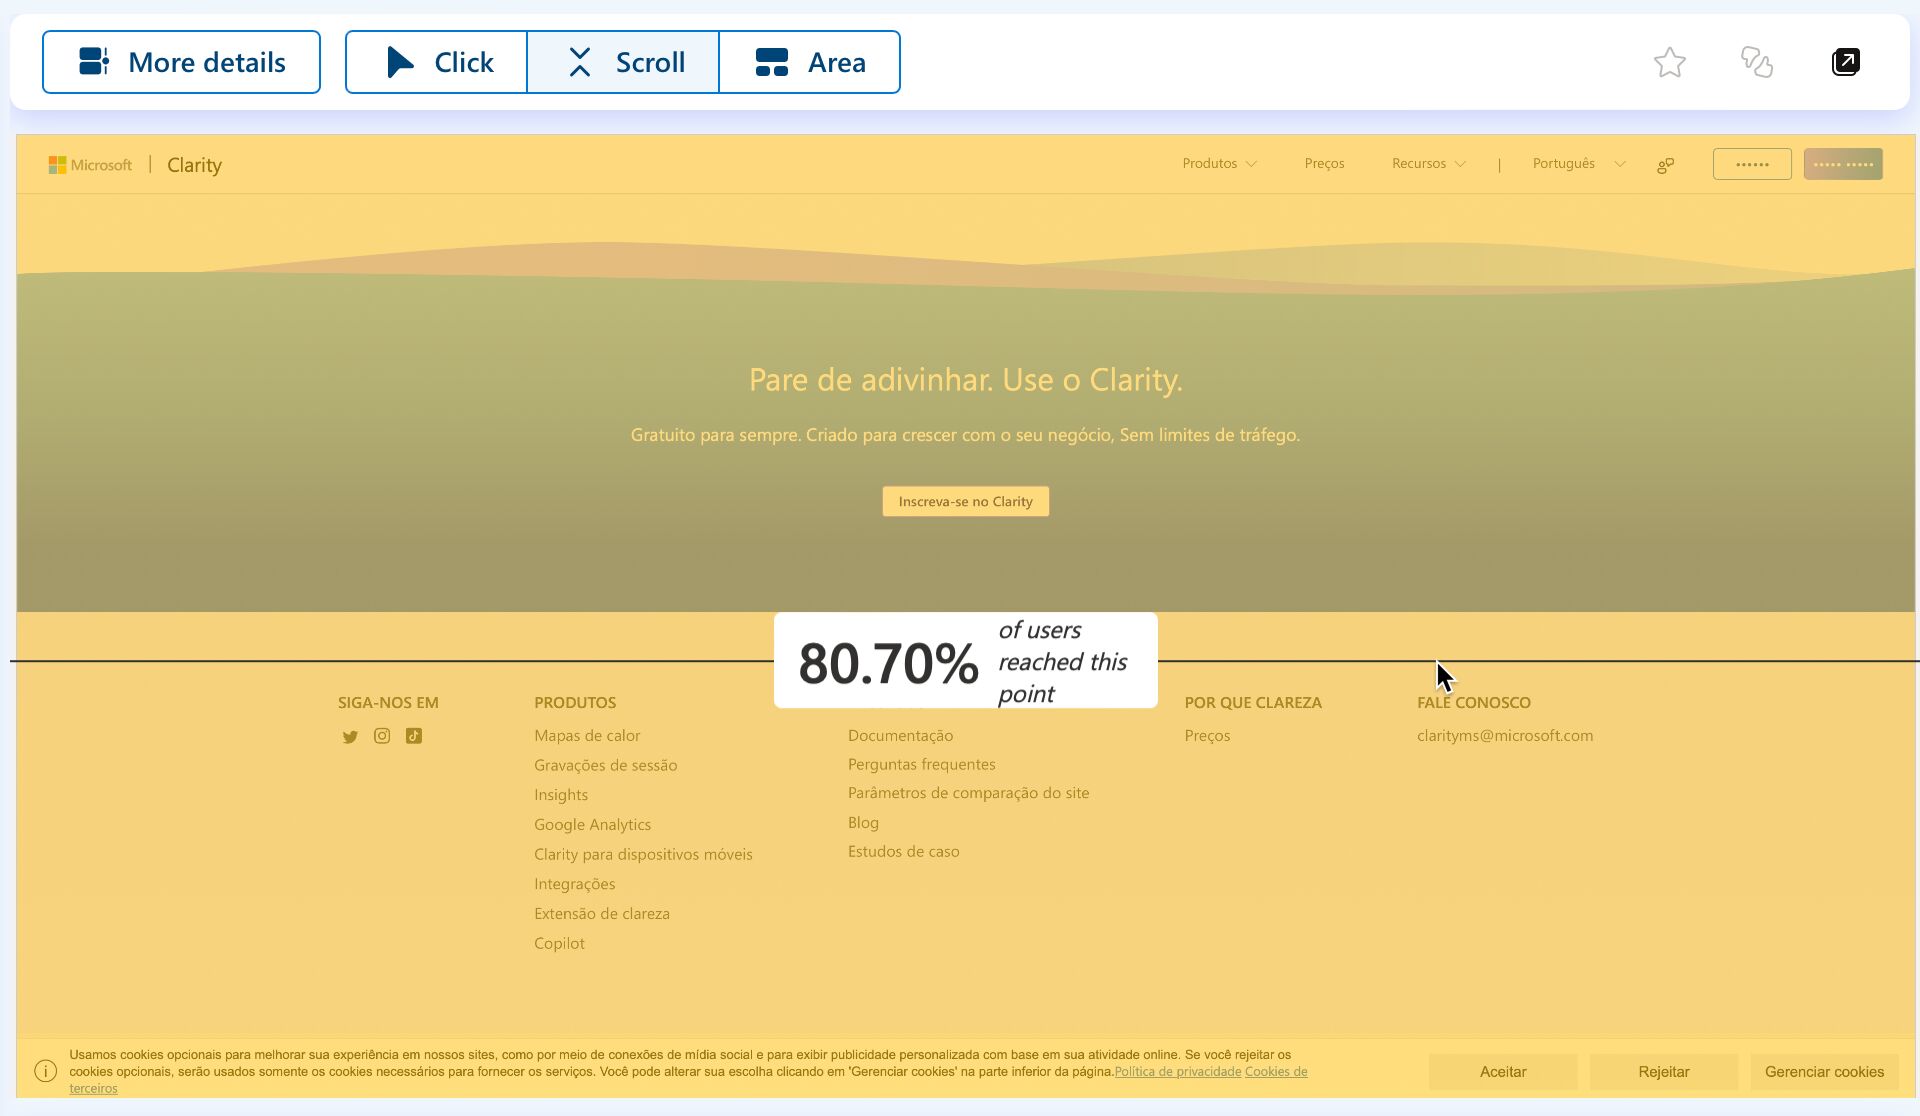 Scroll depth report in Microsoft Clarity.
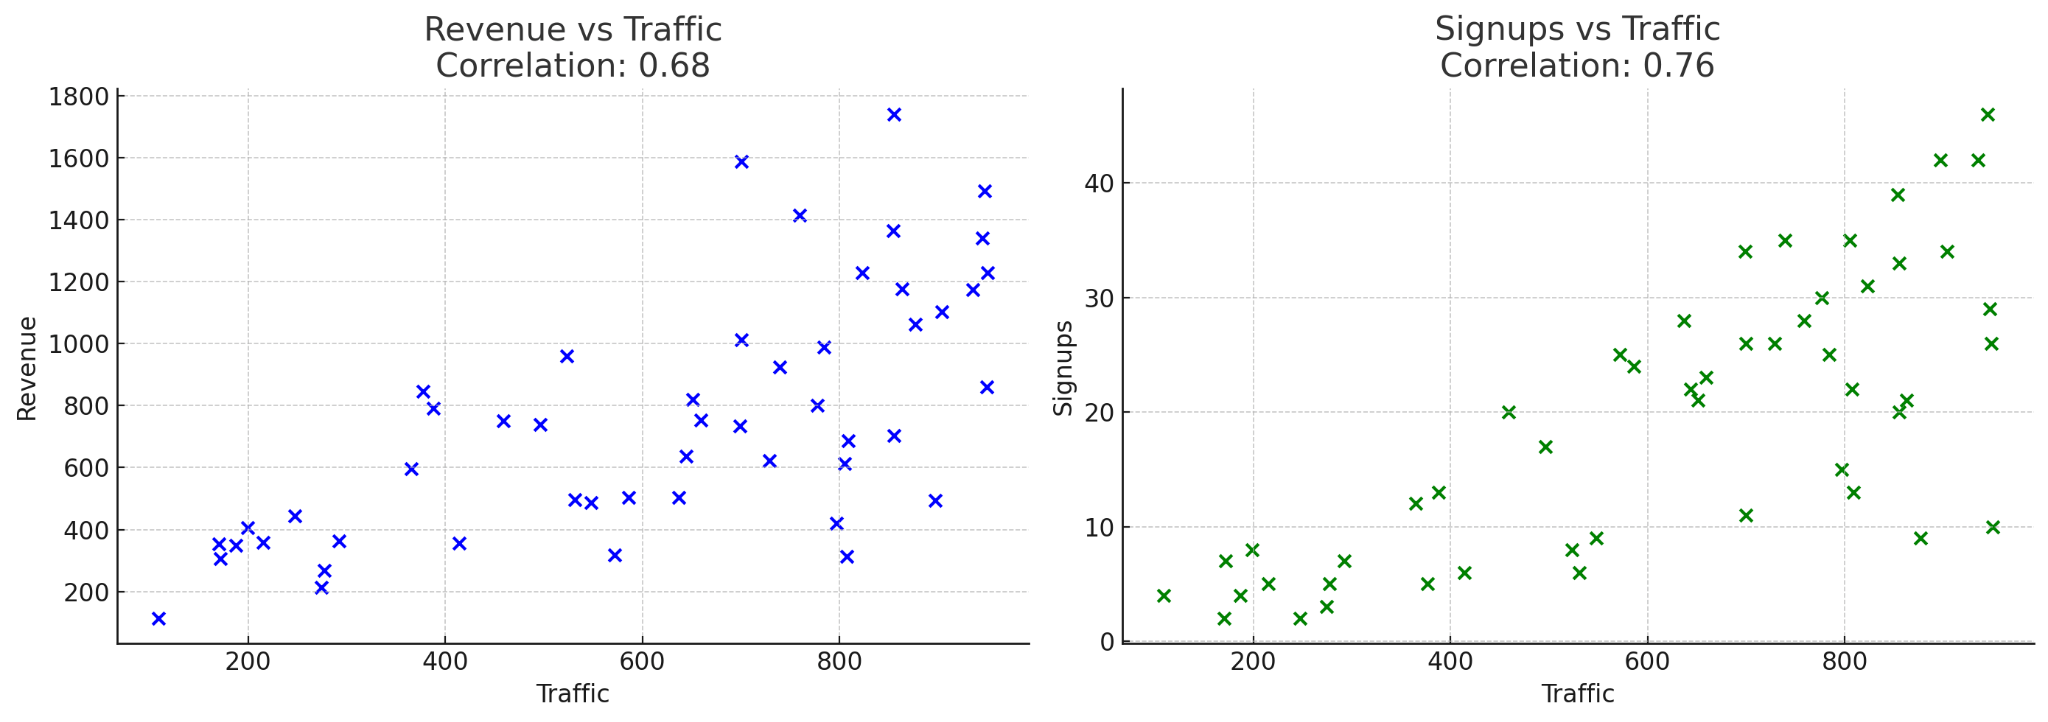 Correlation analysis done entirely by ChatGPT.
Final thoughts