Bitcoin Is One Candle Away From $141,300 Breakout, Chart Master Warns
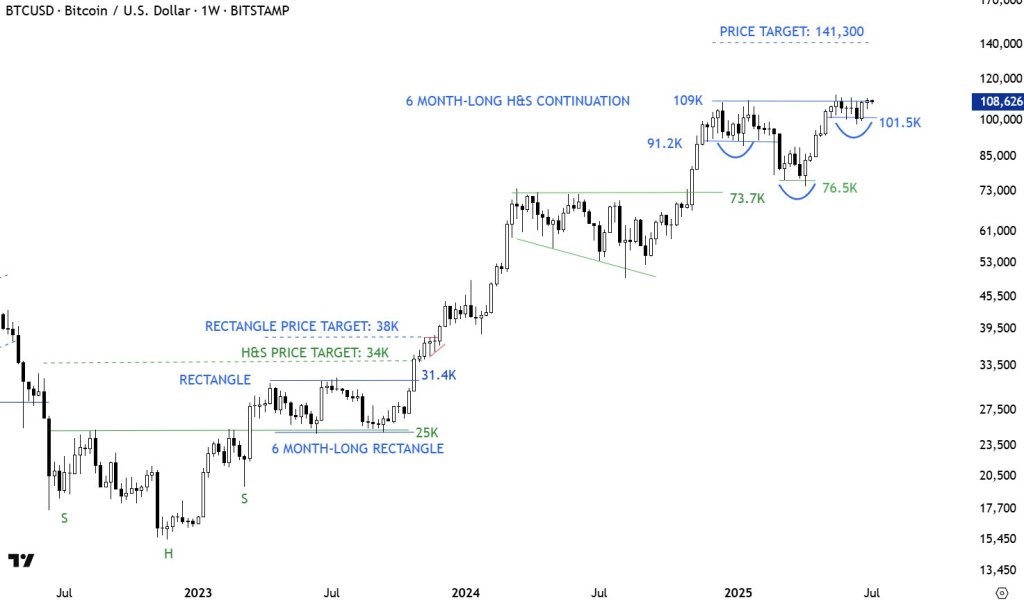
Top analyst Aksel Kibar (CMT) believes Bitcoin is approaching a decisive moment on the weekly chart. In a post shared on 9 July 2025, the veteran technician noted that BTC/USD is “holding right at the pattern boundary.” The annotated...
 AbJimroe

Reason to trust
![]()
Strict editorial policy that focuses on accuracy, relevance, and impartiality
Created by industry experts and meticulously reviewed
The highest standards in reporting and publishing
Strict editorial policy that focuses on accuracy, relevance, and impartiality
Morbi pretium leo et nisl aliquam mollis. Quisque arcu lorem, ultricies quis pellentesque nec, ullamcorper eu odio.
Top analyst Aksel Kibar (CMT) believes Bitcoin is approaching a decisive moment on the weekly chart. In a post shared on 9 July 2025, the veteran technician noted that BTC/USD is “holding right at the pattern boundary.” The annotated chart he released—covering Bitstamp weekly prices back to mid-2022—shows the cryptocurrency compressing directly beneath a horizontal resistance band at $109,000, the neckline of what he labels a six-month head-and-shoulders (H&S) continuation formation.
Bitcoin Poised For $141,300
Kibar’s chart first revisits the basing sequence that reversed the 2022 bear cycle. A textbook inverse head-and-shoulders bottom completed in early-2023, with troughs at roughly $17,600 (left shoulder), $15,500 (head) and $19,500 (right shoulder). The breakout above the neckline sent Bitcoin to $31,400.
Immediately thereafter, price stalled in a six-month rectangle bounded by $25,000 support and $31,400 resistance. The eventual topside resolution propelled the market to the rectangle’s implied target of $38,000, validating two consecutive classical projections in less than a year. Afterwards, the BTC price grinded higher. Below $73,700, BTC consolidated in a falling wedge, ending with a breakout toward $109,000.
 Bitcoin price analysis | Source: X @TechCharts
From that point, the initial pullback bottomed at $91,200, creating what Kibar designates as the left shoulder. A deeper descent to $76,500 carved out the head. Then, the Bitcoin price formed the right shoulder at $101,500, echoed by the blue bowl-shaped arc on the chart.
Throughout this structure the neckline at $109,000 remained intact, acting as a clear demarcation between consolidation and fresh highs. The inverse head-and-shoulders pattern spans roughly half a year, matching the analyst’s “6-month-long” annotation.
Using the orthodox H&S continuation rule—adding the vertical distance from the head ($73,700) to the neckline ($109,000) to the breakout level—Kibar derives a price objective of $141,300. He notes in an X reply that this target is separate from the earlier $137,000 objective, which came from a larger cup-with-handle on the monthly scale. In other words, the shorter-term weekly pattern now projects modestly higher than the longer-term structure.
At press time Bitcoin, Bitcoin traded near $111,000, surpassing the neckline. However, from a technician’s standpoint, the breakout still needs to confirm with the weekly close. Confirmation requires a decisive weekly settlement north of the $109,000 neckline. As Kibar notes: “Breakout needs to take place with a long white candle, similar to previous pattern completions. There should be no hesitation.”
Invalidation would emerge on a weekly close back below the most recent swing-low support at $101,500; deeper failure beneath $91,2000 would unravel the pattern entirely.
For now, Bitcoin sits at the fulcrum of its six-month equilibrium. A weekly candle or two should reveal whether the largest digital asset can convert yet another classical chart formation into a measured move—this time toward mid-six-figure territory.
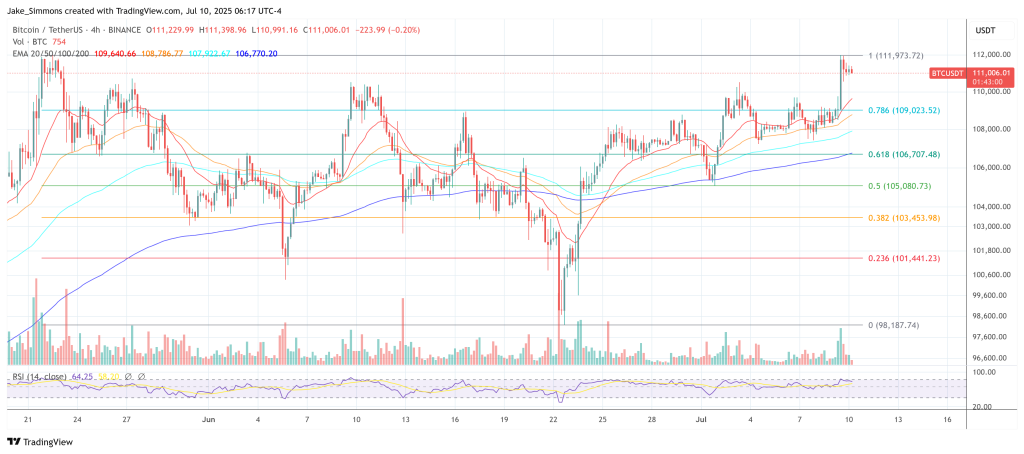 BTC price, 4-hour chart | Source: BTCUSDT on TradingView.com
Featured image created with DALL.E, chart from TradingView.com


/cdn.vox-cdn.com/uploads/chorus_asset/file/25826092/257467_Meta_Quest_3S_AKrales_0140.jpg)
/cdn.vox-cdn.com/uploads/chorus_asset/file/25824990/dsc08924_processed.jpg)