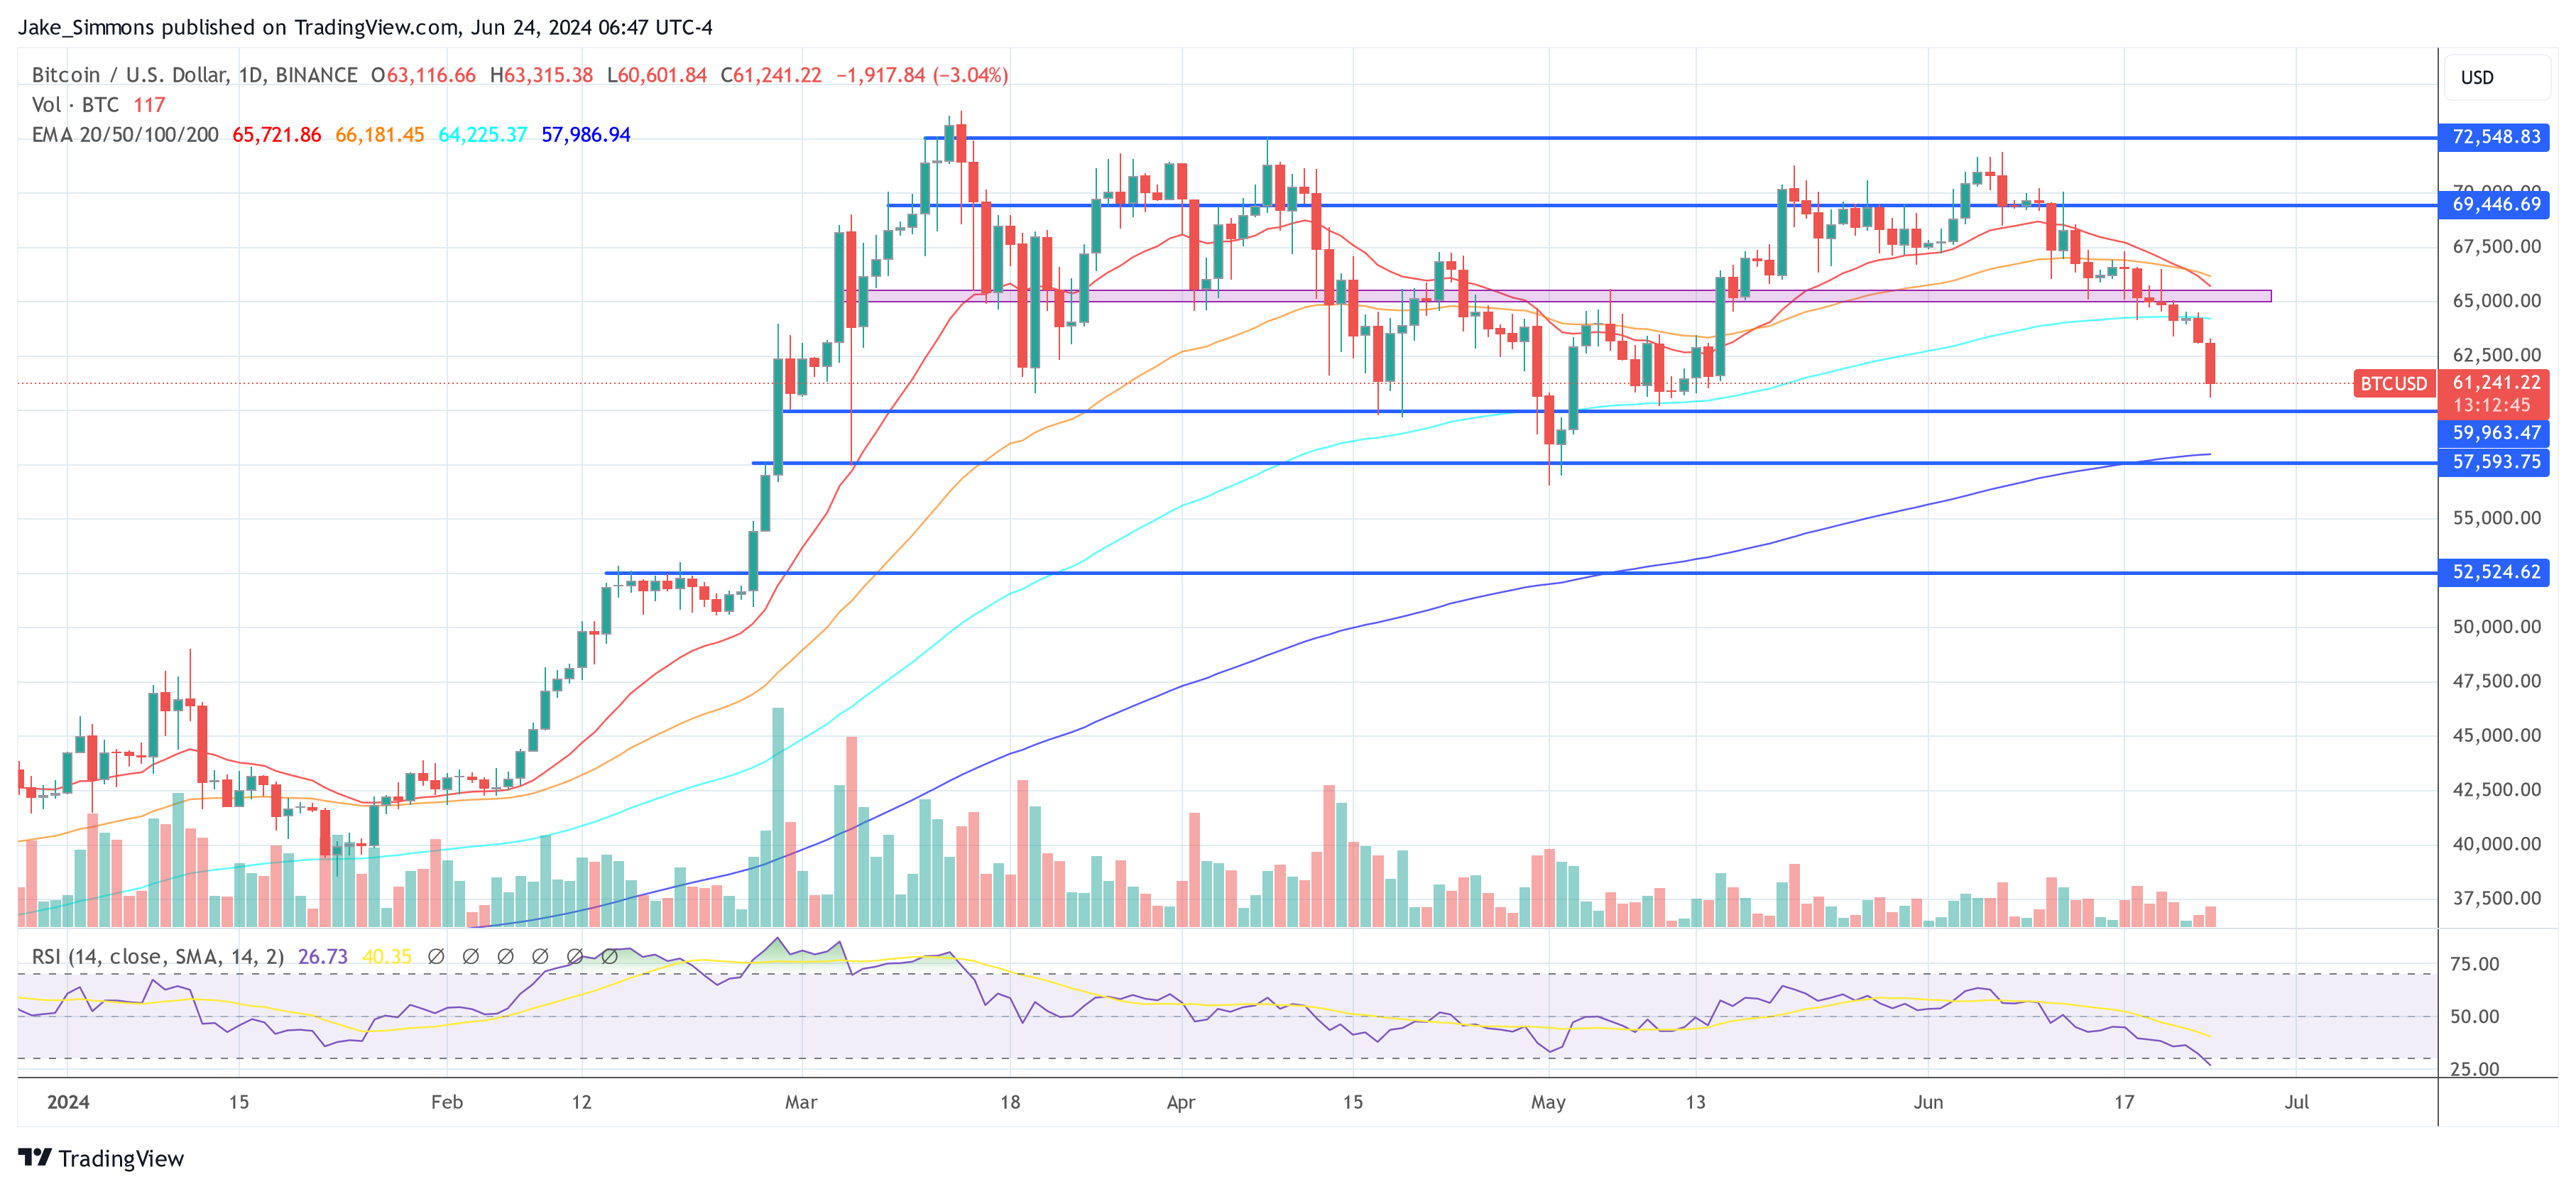
Bitcoin Price Crashes Below $61,000: The Main Reasons
In the last 24 hours, the Bitcoin (BTC) price fell by up to 4.8%, plummeting to a new low of $60,601 after trading above $64,000 just a day earlier. This decline can be attributed to a combination of factors,...

In the last 24 hours, the Bitcoin (BTC) price fell by up to 4.8%, plummeting to a new low of $60,601 after trading above $64,000 just a day earlier. This decline can be attributed to a combination of factors, including developments from the Mt. Gox saga, a significant liquidation of long positions, and ongoing miner capitulation.
#1 Mt. Gox News Shakes Market Confidence
The sudden and steep decline from $62,900 to $60,601 in Bitcoin’s price coincided closely with a new announcement from the trustees of the defunct Bitcoin exchange, Mt. Gox. This exchange, central to one of the earliest and largest Bitcoin thefts, declared it would start repaying victims using the stolen assets from a 2014 hack in July 2024.
According to Nobuaki Kobayashi, the rehabilitation trustee, the repayment process will include Bitcoin (BTC) and Bitcoin Cash (BCH) and start in early July. “The Rehabilitation Trustee has been preparing to make repayments in Bitcoin and Bitcoin Cash under the Rehabilitation Plan […] The repayments will be made from the beginning of July 2024,” the announcement reads.
This news was perceived negatively by the market, primarily due to fears of oversupply from beneficiaries likely selling off assets that have massively appreciated since their initial investment period before 2013. In May 2023, the trustee moved over 140,000 BTC, worth approximately $9 billion.
This transaction was significant as it was the first movement of these funds in five years, tracked closely by analysts and traders. Market reactions were immediate; Bitcoin prices tumbled as speculations about potential market flooding with these repaid coins took hold.
#2 Record Liquidations Of Long Positions
Adding to the downward pressure, there was a notable surge in the liquidation of long BTC positions. According to the latest data from Coinglass, a staggering $85.4 million worth of long positions were liquidated. This event marks the largest liquidation since April 30 and May 1, when over $195 million ($95 million and $100 million respectively) in longs were liquidated, correlating with a 12.5% price drop over those two days.
Such liquidations occur when the market price reaches the liquidation price of leveraged positions, triggering automatic sell-offs to cover the losses, further driving the price down. This cascade effect contributes significantly to rapid price declines and increased market volatility.
#3 Ongoing Miner Capitulation Adds To Sell Pressure
The third critical factor affecting Bitcoin’s price is the ongoing miner capitulation. Miner capitulation refers to a situation where miners, particularly those operating with marginal efficiency, begin selling their mined BTC to cover operational costs due to unprofitability. This phase can exert substantial downward pressure on Bitcoin prices as it increases the supply of Bitcoin being sold in the market.
As reported by NewsBTC, renowned crypto analyst Willy Woo and others have pointed out that miner capitulation is a crucial phase to monitor, especially following the Bitcoin halving events that reduce miner rewards by half, thereby straining their profitability. Woo noted recently that the recovery from such capitulations has historically been slow and tied closely to the resurgence in mining activity and hash rates.
Crypto expert Jelle, speaking via X, highlighted the ongoing nature of this capitulation today, saying, “Hash Ribbons are showing that miner capitulation is ongoing — exactly what you want to see post-halving. Generally speaking, the market starts rallying once that capitulation phase comes to an end.”
At press time, BTC traded at $61,241.
 BTC price dropped below $61,000, 1-day chart | Source: BTCUSD on TradingView.com
Featured image from iStock, chart from TradingView.com

 UsenB
UsenB 


