BNB Price Reclaims $600 and Bulls Could Now Aim For New 2024 High
BNB price is attempting a fresh increase from the $550 zone. The price cleared the $600 resistance and might extend its increase above $630. BNB price started a fresh increase after it cleared the $550 resistance zone. The price...
 Konoly

BNB price is attempting a fresh increase from the $550 zone. The price cleared the $600 resistance and might extend its increase above $630.
BNB price started a fresh increase after it cleared the $550 resistance zone. The price is now trading above $580 and the 100 simple moving average (4 hours). There is a key bullish trend line forming with support at $592 on the 4-hour chart of the BNB/USD pair (data source from Binance). The pair could gain bullish momentum if it clears the $608-$610 resistance zone.BNB Price Gains Strength
After forming a base above the $520 level, BNB price started a fresh increase. There was a steady increase above the $550 and $565 resistance levels, like Ethereum and Bitcoin.
The bulls pushed the price above the $580 pivot level and the 61.8% Fib retracement level of the downward wave from the $630 swing high to the $512 low. More importantly, the price is now trading above $580 and the 100 simple moving average (4 hours).
It is consolidating just above the 76.4% Fib retracement level of the downward wave from the $630 swing high to the $512 low. There is also a key bullish trend line forming with support at $592 on the 4-hour chart of the BNB/USD pair.
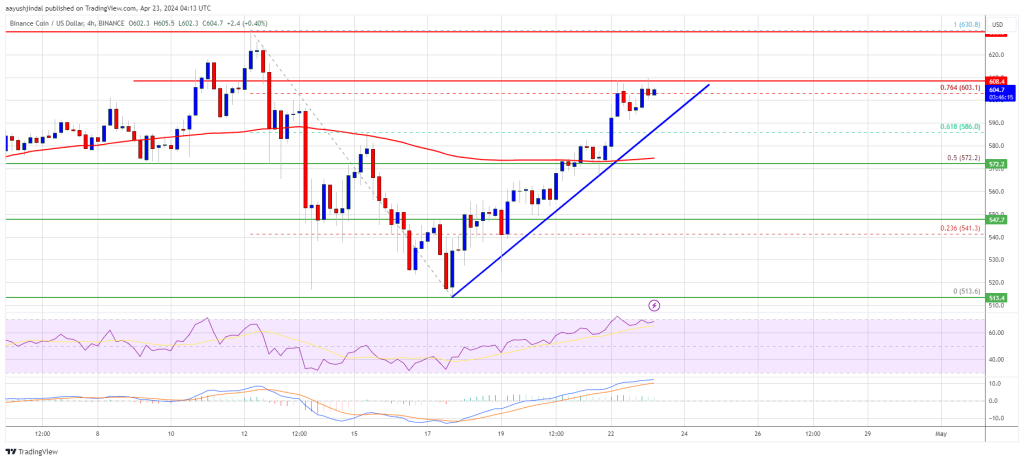
Source: BNBUSD on TradingView.com
Immediate resistance is near the $608 level. The next resistance sits near the $630 level. A clear move above the $630 zone could send the price further higher. In the stated case, BNB price could test $650. A close above the $650 resistance might set the pace for a larger increase toward the $680 resistance. Any more gains might call for a test of the $720 level in the coming days.
Are Dips Supported?
If BNB fails to clear the $608 resistance, it could start a downside correction. Initial support on the downside is near the $592 level and the trend line.
The next major support is near the $585 level. The main support sits at $570. If there is a downside break below the $570 support, the price could drop toward the $550 support. Any more losses could initiate a larger decline toward the $532 level.
Technical Indicators
4-Hours MACD – The MACD for BNB/USD is gaining pace in the bullish zone.
4-Hours RSI (Relative Strength Index) – The RSI for BNB/USD is currently above the 50 level.
Major Support Levels – $592, $585, and $570.
Major Resistance Levels – $608, $630, and $650.
Disclaimer: The article is provided for educational purposes only. It does not represent the opinions of NewsBTC on whether to buy, sell or hold any investments and naturally investing carries risks. You are advised to conduct your own research before making any investment decisions. Use information provided on this website entirely at your own risk.


.jpeg?trim=0,89,0,88&width=1200&height=800&crop=1200:800)