Fact Or Fantasy? Decoding The Bitcoin Rainbow Chart’s $250,000 Prediction
Bitcoin, the undisputed king of cryptocurrencies, faces a challenge as it approaches a critical moment. After a stellar run in the first half of 2024, breaking past the crucial $71,000 barrier, the digital gold has retreated, currently hovering around...

Bitcoin, the undisputed king of cryptocurrencies, faces a challenge as it approaches a critical moment. After a stellar run in the first half of 2024, breaking past the crucial $71,000 barrier, the digital gold has retreated, currently hovering around the crucial $61,000 support zone. This recent dip has sparked a debate amongst analysts, with some clinging to bullish long-term outlooks and others cautioning of potential headwinds.
Rainbow Whispers: A Golden Buying Opportunity Or Fool’s Gold?
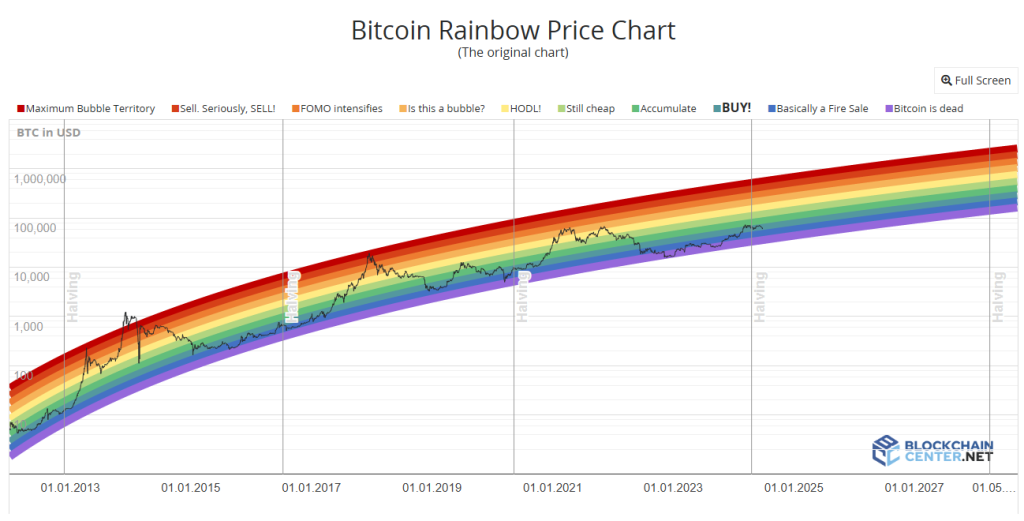
One factor keeping some bulls optimistic is the Bitcoin Rainbow Chart, a popular tool that analyzes price movements on a logarithmic scale. This chart currently positions Bitcoin in the “Buy” zone, suggesting there’s ample room for growth before reaching a peak.
Additionally, historical price cycles, specifically those following halving events (where the number of Bitcoins rewarded to miners is halved), point towards a potential maximum price point around September-October 2025. This optimistic timeline translates to a potential price target of $260,000 or even higher, according to some analysts.
 Source: Blockchain Center
However, not everyone is swayed by the Rainbow’s charm. Critics point out that the chart is a historical indicator, and past performance doesn’t guarantee future results. The recent decline in the “Coinbase Premium Index” throws a bucket of cold water on the optimist’s parade.
This index reflects the difference in price between Bitcoin traded on US exchange Coinbase and international markets. A negative index, as seen currently, suggests waning interest from US investors, a significant market segment.
Investor Jitters And Declining Open Interest
Another cause for concern is the palpable fear and caution gripping investors. The recent price drops have shaken confidence, with many adopting a wait-and-see approach. This sentiment is reflected in the sharp decline of “Open Interest,” a metric that tracks the total value of outstanding futures contracts.
With investors hesitant to take long positions on Bitcoin due to the recent slump, Open Interest has dropped significantly, indicating a potential pullback in market participation.
However, some analysts see this decline as a necessary correction. They argue that an overheated futures market fueled by excessive leverage can lead to unsustainable bubbles. The current drop, they believe, is weeding out these overleveraged players, paving the way for a more stable, long-term growth trajectory for Bitcoin.
A Bumpy Ride Ahead For Bitcoin?
The future of Bitcoin remains shrouded in some uncertainty. While the potential for significant growth based on historical trends and the Rainbow Chart is undeniable, short-term investor sentiment and declining US market participation cannot be ignored.
The coming months will be crucial in determining whether Bitcoin can weather the current storm and resume its ascent or succumb to bearish pressures.
Featured image from Shutterstock, chart from TradingView

 JaneWalter


