How We Rebuilt AI Visibility Measurement From The Ground Up
Key Takeaways The first post in this series made the case that most AI visibility tracking is built on the wrong foundation: generic prompts measuring hypothetical users, deterministic tools applied to a probabilistic system. If that diagnosis is right,...
 KickT
KickT
Key Takeaways
The core problem with most AI visibility prompts isn’t that they’re wrong; it’s that they’re missing the context real users bring. Generic inputs produce generic, unactionable data. The SPIV framework (Segment, Persona, Intent, Variable) structures prompts around four variables drawn from real user data, turning stateless AI visibility tracking inputs into high-fidelity user proxies. Once prompts are grounded in real context, the variation you observe in model responses becomes informative rather than noise. Visibility can then be expressed as a probability distribution. Measurement operates on two layers: primary metrics from the tracking platform, and a secondary layer of calculated metrics (run length, Shannon entropy, Gini coefficient, and KL divergence) that reveal the stability and competitive dynamics behind the surface numbers. This approach naturally connects measurement to business priorities. It becomes much harder to justify tracking low-intent queries with no connection to how your product is actually bought.The first post in this series made the case that most AI visibility tracking is built on the wrong foundation: generic prompts measuring hypothetical users, deterministic tools applied to a probabilistic system. If that diagnosis is right, the obvious next question is: what does a better approach actually look like?
That’s what this post covers. What we built at NP Digital to address both the measurement problem and a second issue that compounded it: early AI visibility audits were trying to do too much at once, producing outputs so dense that clients couldn’t identify a single clear action to take. The rebuild addressed both problems together.
The result is a methodology built around structured prompt construction, two layers of metrics, and outputs that point to specific, defensible actions. Here’s how it works.
Why the Old Audit Approach Wasn’t Working
Before explaining what we built, it helps to explain what we were moving away from, and why.
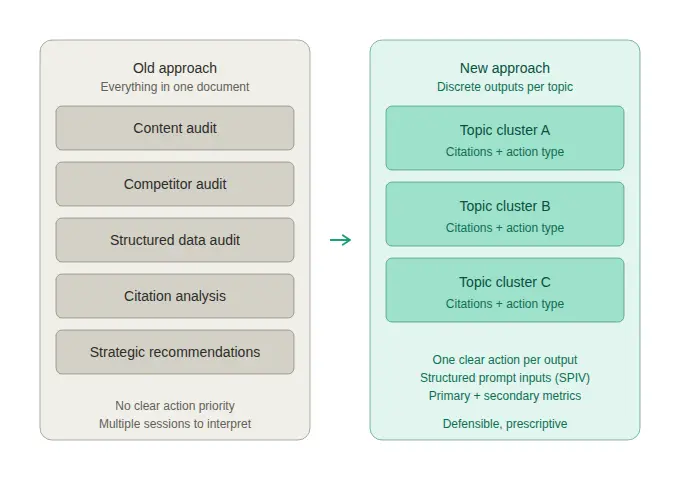
Early AI visibility audits, including our own initial attempts, were structured like SEO audits. A single document tried to cover everything at once: a content audit, a competitor audit, a structured data review, citation analysis, and strategic recommendations, all bundled into one output. The logic made sense at the time. SEO audits had always worked this way. Why would a GEO audit be different?
The answer, in practice, was that clients couldn’t use them. Data points conflicted. The strategic direction wasn’t clear. The same document had to be re-presented multiple times before anyone could agree on what to do first. We were producing thorough work that left clients more confused than when they started.
Two problems were running in parallel. The first was the measurement problem I covered previously: generic prompts producing data that looked meaningful but wasn’t representative of real buyer behavior. The second was a presentation problem: even if the data had been better, the format buried the signal in too much noise.
The rebuild addressed both. On the measurement side, we moved to structured prompt construction through the SPIV framework. On the output side, we separated the analysis into discrete, digestible pieces: each focused on a specific topic cluster, each pointing to a defined type of action. Clients stopped needing multiple sessions to understand what they were looking at.
Introducing the SPIV Framework
The starting point is familiar data. The same sources that feed traditional keyword research, including People Also Ask results, Google Search Console data, community platforms like Reddit and Quora, and first-party data like customer service transcripts where available, provides the raw material. The difference is what happens next.
Instead of using those inputs as-is, SPIV treats them as raw material and injects four structured variables into each prompt. The practical effect: it turns stateless AI keyword research inputs into pseudo-stateful responses by giving the model the persona context it would otherwise be missing.
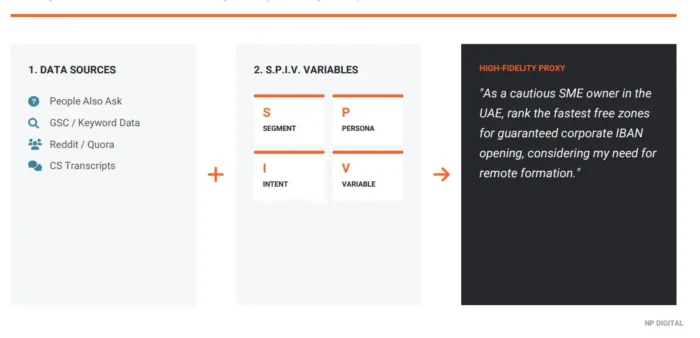
Each variable does a specific job:
Segment: The market category or business context. Grounds the prompt in a defined situation: ‘SME owner in the UAE’ rather than ‘business owner.’ This is the broadest layer of context. Persona: The specific user type, including relevant traits: risk tolerance, level of prior knowledge, geographic or professional context. This is where abstract ‘users’ become real people with real constraints. Intent: What the user is actually trying to accomplish, not the topic they’re searching but the outcome they need. ‘Understand my compliance obligations’ is different from ‘find the cheapest option.’ Separating these surfaces meaningful differences in how models respond. Variable: A single modifier that can be shifted to test sensitivity: ‘fastest’ vs. ‘cheapest’ vs. ‘most reliable.’ Isolating one variable at a time makes the data interpretable. Change everything and you can’t explain what moved.The table below shows what this transformation looks like in practice, using anonymized examples from real audit work:
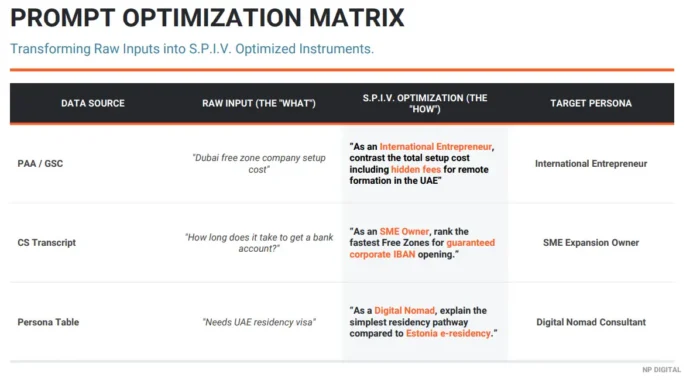
The difference between the raw input and the SPIV-optimized prompt isn’t cosmetic. The raw prompt describes no one in particular. The optimized prompt describes a specific person in a specific situation trying to accomplish a specific outcome. That specificity is what makes the model’s response meaningful as a measurement input.
A well-constructed set of SPIV prompts doesn’t need to be large. Representativeness matters more than volume. A focused set of 15 to 30 prompts mapped to your key buyer personas and intent stages gives more actionable signal than hundreds of generic variations.
The Two Layers of Measurement: Primary and Secondary Metrics
Once prompts are properly constructed, the analysis operates on two distinct layers. Understanding the difference between them is what makes the output useful rather than just interesting.
Primary metrics come from the tracking platforms directly, including Writesonic and Profound. These include visibility percentage, share of voice, and mention frequency. They’re the standard outputs most teams are already familiar with and they provide the baseline picture: how often does your brand appear, and how does that compare to competitors?
The four secondary metrics, and what each one tells you:
 Shannon entropy: A measure of how evenly visibility is distributed across the brands appearing for a given topic. High entropy means no brand dominates, meaning the model is pulling from a wide, fragmented field. Low entropy means the results are concentrated, and that a small number of brands are taking most of the mentions. Low entropy topics are harder to break into; high entropy topics are more contestable.
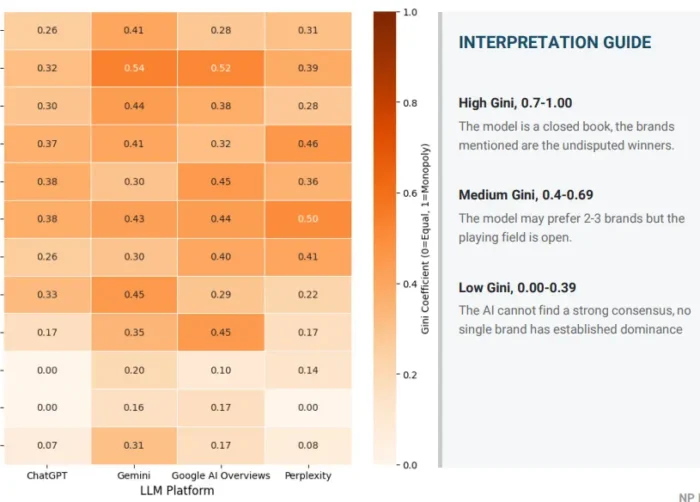
Gini coefficient: Where Shannon entropy tells you how distributed results are, the Gini coefficient tells you the degree of concentration. A high Gini score means visibility is dominated by one or two brands. A low score means the field is relatively open. Together with entropy, this gives a picture of whether a topic is winner-takes-most or genuinely shared.
Shannon entropy: A measure of how evenly visibility is distributed across the brands appearing for a given topic. High entropy means no brand dominates, meaning the model is pulling from a wide, fragmented field. Low entropy means the results are concentrated, and that a small number of brands are taking most of the mentions. Low entropy topics are harder to break into; high entropy topics are more contestable.
Gini coefficient: Where Shannon entropy tells you how distributed results are, the Gini coefficient tells you the degree of concentration. A high Gini score means visibility is dominated by one or two brands. A low score means the field is relatively open. Together with entropy, this gives a picture of whether a topic is winner-takes-most or genuinely shared.
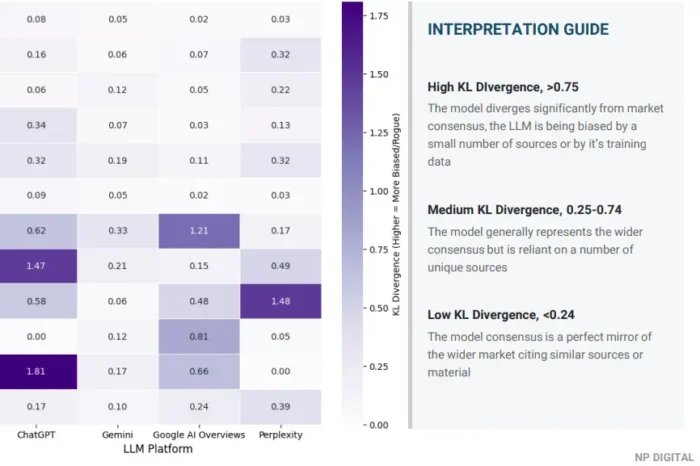
 KL divergence: In a traditional statistical context, this metric measures how a distribution changes over time. We’ve adapted it here to serve a different purpose: measuring how far an individual platform’s results drift from the group average across all tracked platforms. A low score for a given platform means its brand rankings for that topic are broadly in line with the consensus across ChatGPT, Gemini, and Perplexity. A high score means that platform is picking a significantly different set of brands. That’s a meaningful finding. It tells you whether your visibility is genuinely broad or whether it’s concentrated in one model’s view of the world.
None of these metrics is useful in isolation. Run length tells you how stable your visibility is; entropy and Gini tell you how competitive the topic is; KL divergence tells you whether that visibility holds across platforms or is fragile in a way your headline numbers don’t reveal. Read together, they give a diagnostic picture that primary metrics alone can’t produce.
What the Data Tells You
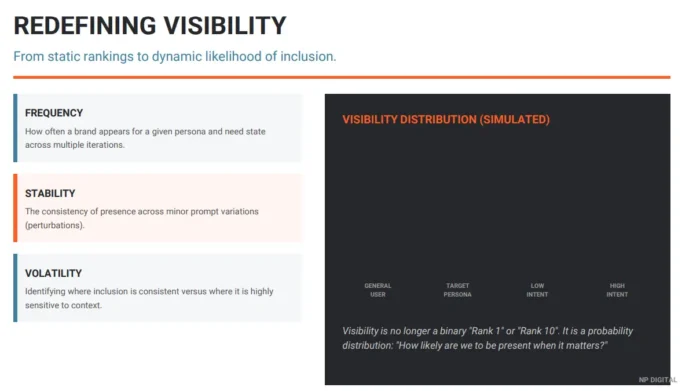
With SPIV-structured prompts and both metric layers in place, visibility stops being a single number and becomes a probability distribution. The question changes from ‘where do we rank?’ to ‘how reliably do we appear when the conditions that actually matter are present?’
In practice, this approach surfaces findings across three dimensions that generic tracking misses entirely.
The visibility distribution itself. Some brands are category staples: they appear consistently across multiple runs of the same prompt, across slight variations in phrasing, across different platforms. Others are volatile outliers: they surface occasionally but can’t be relied on. Generic tracking averages this out and produces a headline figure that obscures the difference. The secondary metrics separate the two clearly.
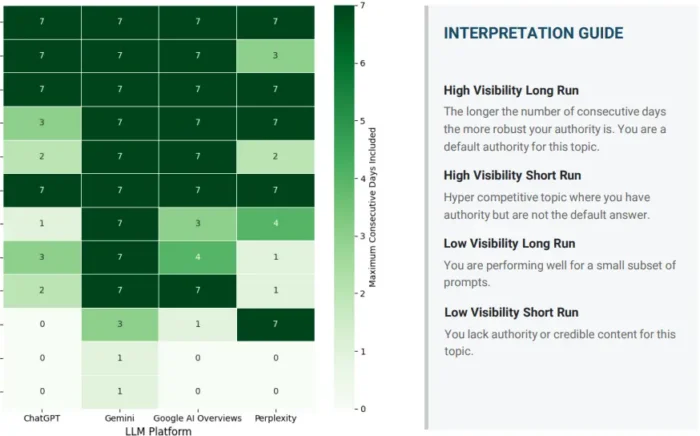
The platform dimension. Visibility that holds on Google Gemini but not on ChatGPT is a meaningful finding, not just a data point to average away. Different models draw on different training data, weigh different source types, and respond differently to the same underlying intent. KL divergence makes this visible. A brand that appears strong in aggregate but has a high divergence score on one platform has a concentration risk that matters strategically, especially if that platform is where your buyers actually research.
The topic dimension. This is often the most strategically important finding in the whole audit. Brands regularly show strong visibility in broad, low-intent queries (the general category terms that show up well in standard tracking), but near-zero presence in the specific, high-intent topics their buyers are researching at the point of decision.
In one audit, a brand showed visibility above 65 percent for general licensing topics across platforms. For compliance and banking topics (the two areas most directly connected to their buyers’ decision-making process), visibility was zero across ChatGPT, Google AI Overviews, and Perplexity. The standard tracking looked healthy. The actual picture was that the brand was invisible at the moments that mattered most.
Generic prompts miss this because they aren’t asking the right questions. SPIV-structured prompts surface it because they’re built around the contexts where decisions actually happen.
This is also where the measurement connects directly to AI SEO strategy. Once you know which topics show gaps, which platforms are most divergent, and which competitors are holding the positions you’re not, you have a defensible brief for content and PR investment. The audit doesn’t just tell you where you are. It tells you where to go.
FAQs
How do you track AI visibility?
Tracking AI visibility starts with a defined prompt set run across the major platforms: ChatGPT, Google Gemini, Perplexity, and Google AI Overviews. Tools like Writesonic and Profound automate this process and export visibility data by brand and topic. The critical step most teams skip is structuring those prompts around real buyer personas and intent contexts rather than generic category terms. Generic prompts produce directional data; structured prompts produce data you can act on.
How do you monitor brand visibility in AI?
Brand visibility in AI is monitored by running structured prompts across platforms on a recurring basis and tracking both primary metrics (visibility percentage, share of voice) and secondary metrics (run length, entropy, Gini coefficient, KL divergence). The primary metrics tell you what the numbers are. The secondary metrics tell you whether those numbers are stable, how competitive the topic is, and whether your visibility is genuinely broad or concentrated on a single platform. Monitoring both layers gives you a picture you can act on.
How do I check AI visibility of my brand?
Start by identifying the topics most relevant to your buyers’ decision-making process, not just the broad category terms, but the specific questions they ask when they’re close to a purchase. Build prompts around those topics using the SPIV framework, run them across ChatGPT, Gemini, Perplexity, and Google AI Overviews, and track how consistently your brand appears. The gap between your visibility in general topics and your visibility in high-intent, decision-stage topics is usually the most important finding.
Conclusion
The shift this methodology makes is simple to state but significant in practice: you’re no longer tracking where you rank. You’re tracking how reliably you appear when it actually matters: for the right persona, at the right intent stage, on the platforms your buyers actually use.
SPIV is how you build the inputs that make that measurement possible. The secondary metrics are how you make sense of what the data is telling you. Together, they turn AI visibility from a headline number into a diagnostic that points somewhere useful.
Knowing where you’re visible and where you’re not is only half the equation. In the final post in this series, I’ll cover what this framework reveals about content strategy, and why the old volume-first approach doesn’t hold up in an answer-driven search environment.