What Data Science Can Do for Site Architectures via @sejournal, @artios_io
Beyond Python, here’s how you can use data science strategies to uncover hidden patterns and insights to boost rankings. The post What Data Science Can Do for Site Architectures appeared first on Search Engine Journal.

The past decade has marked the shift of SEO from spreadsheet-driven, anecdotal best practices to a more data-driven approach, evidenced by the greater numbers of SEO pros learning Python.
As Google’s updates increase in number (11 in 2023), SEO professionals are recognizing the need to take a more data-driven approach to SEO, and internal link structures for site architectures are no exception.
In a previous article, I outlined how internal linking could be more data-driven, providing Python code on how to evaluate the site architecture statistically.
Beyond Python, data science can help SEO professionals more effectively uncover hidden patterns and key insights to help signal to search engines the priority of content within a website.
Data science is the intersection of coding, math, and domain knowledge, where the domain, in our case, is SEO.
So while math and coding (invariably in Python) are important, SEO is by no means diminished in its importance, as asking the right questions of the data and having the instinctive feel of whether the numbers “look right” are incredibly important.
Align Site Architecture To Support Underlinked Content
Many sites are built like a Christmas tree, with the home page at the very top (being the most important) and other pages in descending order of importance in subsequent levels.
For the SEO scientists among you, you’ll want to know what the distribution of links is from different views. This can be visualized using the Python code from the previous article in several ways, including:
Site depth. Content type. Internal Page Rank. Conversion Value/Revenue.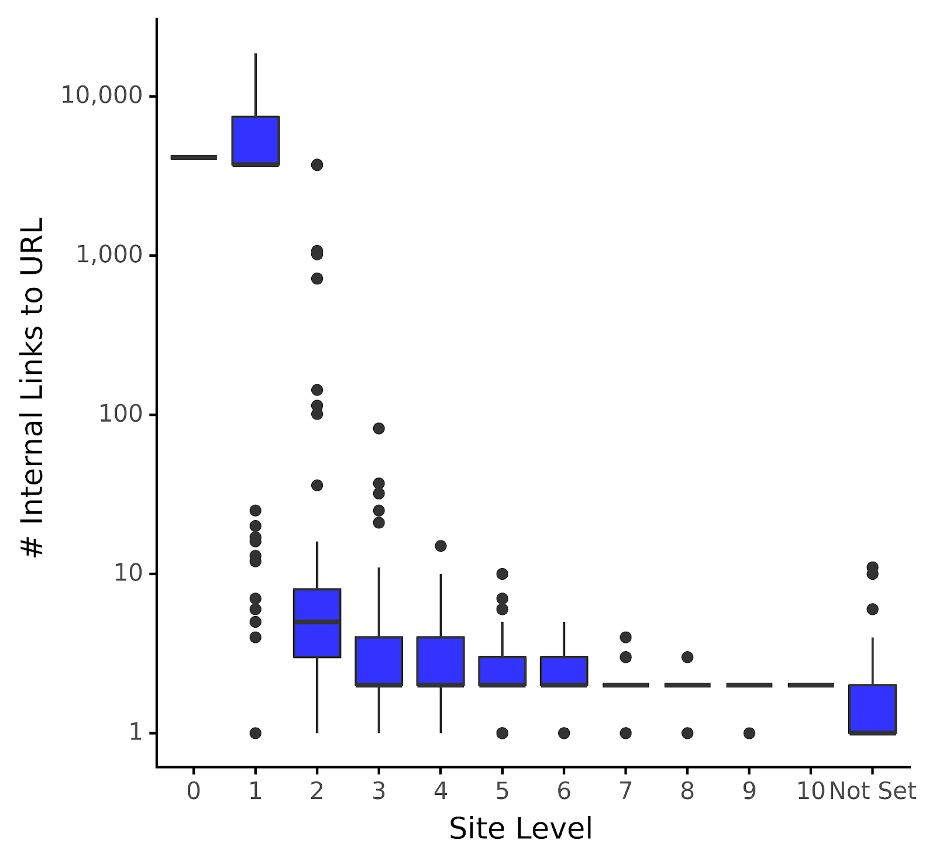 Image by author, December 2023
The boxplot effectively shows how many links are “normal” for a given website at different site levels. The blue boxes represent the interquartile range (i.e., the 25th and 75th quantiles) which is where most (67% to be precise) of the number of inbound internal links lie.
Think of the bell curve, but instead of viewing it from the side (as you would a mountain), you’re viewing it like a bird flying overhead.
For example, the chart shows that for pages that are two levels down from the home page, the blue box indicates that 67% of URLs have between five and nine inbound internal links. We can also see this is considerably (and perhaps unsurprisingly) much lower than pages that are one hop away from the home page.
The thick line that cuts the blue box is the median (50th quantile), representing the middle value. Going with the above example, the median inbound internal links are 7 for site level 2 pages, which is about 5,000 times less than those in site level 1!
On a side note, you may notice that the median line isn’t visible for all blue boxes, the reason being the data is skewed (i.e., not normally distributed like a bell-shaped curve).
Is This Good? Is This Bad? Should SEO Pros Be Worried?
A data scientist with no knowledge of SEO might decide that it’d be better to redress the balance by working out the distribution of internal links to pages by site level.
From there, any pages that are, say, below the median or the 20th percentile (quantile in data science speak) for their given site level, a data scientist might conclude that these pages require more internal links.
As such, this often means that pages that share the same number of hops from the home page (i.e., same site depth level) are of equal importance.
However, from a search value perspective, this is unlikely to be true, especially when you consider that some pages on the same level simply have more search demand than others.
Thus, the site architecture should prioritize those pages with more search demand than those with less demand regardless of their default place in the hierarchy – whatever their level!
Revising True Internal Page Rank (TIPR)
True Internal Page Rank (TIPR), as popularised by Kevin Indig, has taken a rather more sensible approach by incorporating the external PageRank, i.e., earned from backlinks. In simple maths terms:
TIPR = Internal Page Rank x Page Level Authority of Backlinks
Although the above is the non-scientific version of his metric, it’s nonetheless a much more useful and empirical way of modeling what is the normal value of a page’s value within a website architecture. If you’d like the code to compute this, please see here.
Furthermore, rather than applying this metric to site levels, it’s far more instructive to apply this by content type. For an ecommerce client, we see the distribution of TIPR by content type below:
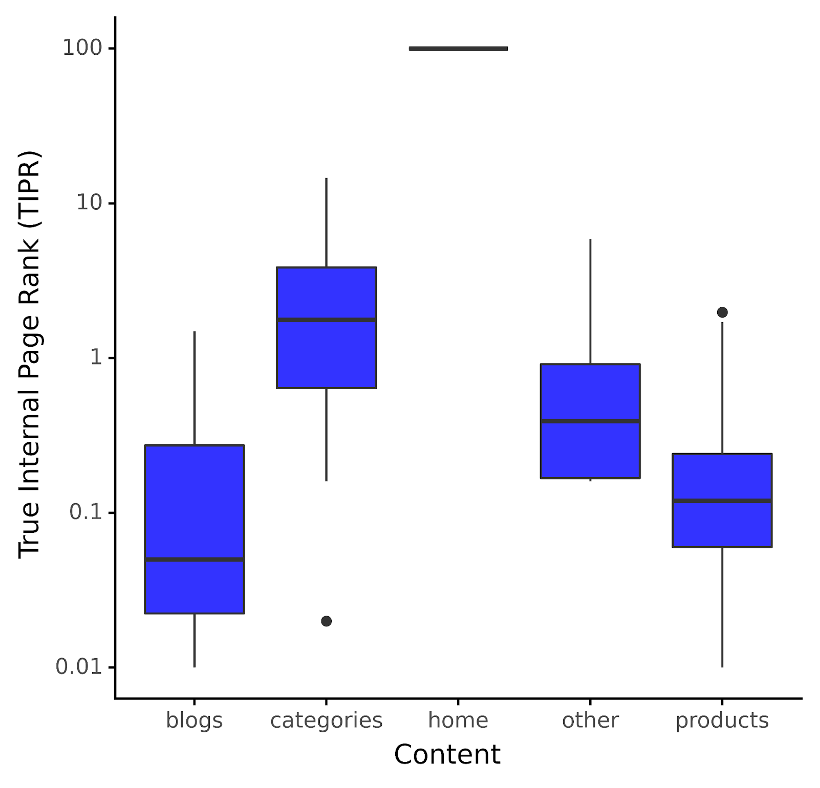 Image by author, December 2023
The plot in this online store’s case is that the median TIPR for categories content or Product Listing Pages (PLPs) is about two TIPR points.
Admittedly, TIPR is a bit abstract, as how does that translate to the amount of internal links required? It doesn’t – at least not directly.
Abstraction notwithstanding, this is still a more effective construct for shaping site architecture.
If you wanted to see which categories were underperforming for their rank position potential, you’d simply see that PLP URLs were below the 25th quantile and perhaps look for internal links from pages of a higher TIPR value.
How many links and what TIPR? With some modeling, that’s an answer for another post.
Introducing Revenue Internal Page Rank (RIPR)
The other important question worth answering is: which content deserves higher rank positions?
Kevin also advocated a more enlightened approach to align internal link structures towards conversion values, which many of you are hopefully already applying to your clients; I must heartily agree.
A simple non-scientific solution is to take the ratio of the ecommerce revenue to the TIPR i.e.
RIPR = Revenue / TIPR
The above metric helps us see what normal revenue per page authority looks like, as visualized below:
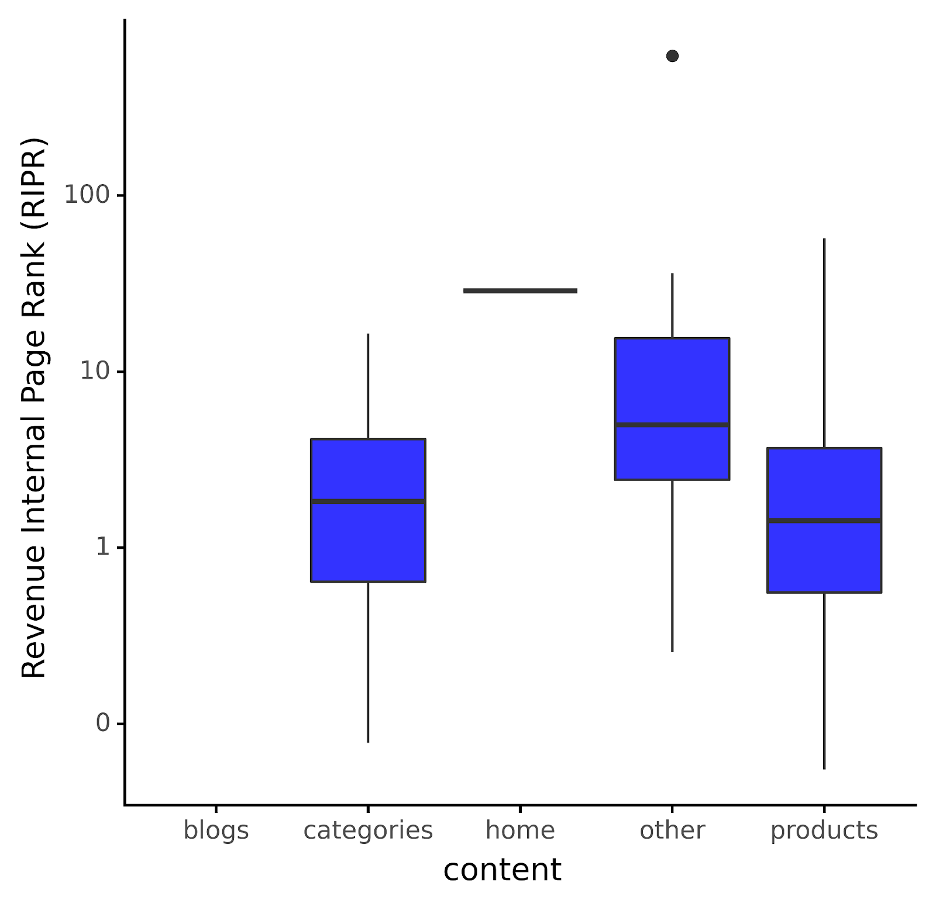 Image by author, December 2023
As we can see, the picture changes somewhat; suddenly, we see no box (i.e., distribution) for blog content because no revenue is recorded against that content.
Practical applications? If we use this as a model by content type, any pages that are higher than the 75th quantile (i.e., north of their blue box) for their respective content type should have more internal links added to them.
Why? Because they have high revenue but are very low in Page Authority, meaning they have a very high RIPR and should therefore be given more internal links to get it closer to the median.
By contrast, those with lower revenue but too many significant internal links will have a lower RIPR and should thus have links taken away from them to allow the higher revenue content to be assigned more importance by the search engines.
A Caveat
RIPR has some assumptions built in, such as analytics revenue tracking being set up properly so that your model forms the basis for effective internal link recommendations.
Of course, as in TIPR, one should model what an internal link is worth in terms of how much RIPR an internal link is worth from any given page.
That’s before we even get to the location of the internal link placement itself.
More resources:
3 Types of Data Science SEO Teams and How They Work Internal Link Structure Best Practices to Boost Your SEO The Complete Guide to On-Page SEOFeatured Image: NicoElNino/Shutterstock

 MikeTyes


