5 Digital Marketing Report Examples to Impress Clients
Most digital marketing reports fail where it matters most: helping clients understand the impact of your work. They’re packed with jargon, vanity metrics, and confusing charts, making it difficult for clients to see the value. The truth is…the best...
 KickT
KickT
Most digital marketing reports fail where it matters most: helping clients understand the impact of your work. They’re packed with jargon, vanity metrics, and confusing charts, making it difficult for clients to see the value.
The truth is…the best digital marketing report examples go beyond data dumps. They highlight wins clearly, align with business goals, and spark smarter conversations. In this article, we’ll look at five report types that help agencies prove ROI, reduce churn, and make clients actually want to read what you send them—built with Whatagraph. Here’s a summary of the reports:
Each example includes key metrics to track and best practices for structuring insights in a way that resonates with clients.
Let’s dig in.
1. Cross-Channel Marketing Analytics Report
Best for: Providing a high-level overview of overall marketing effectiveness, budget distribution, and return on ad spend.
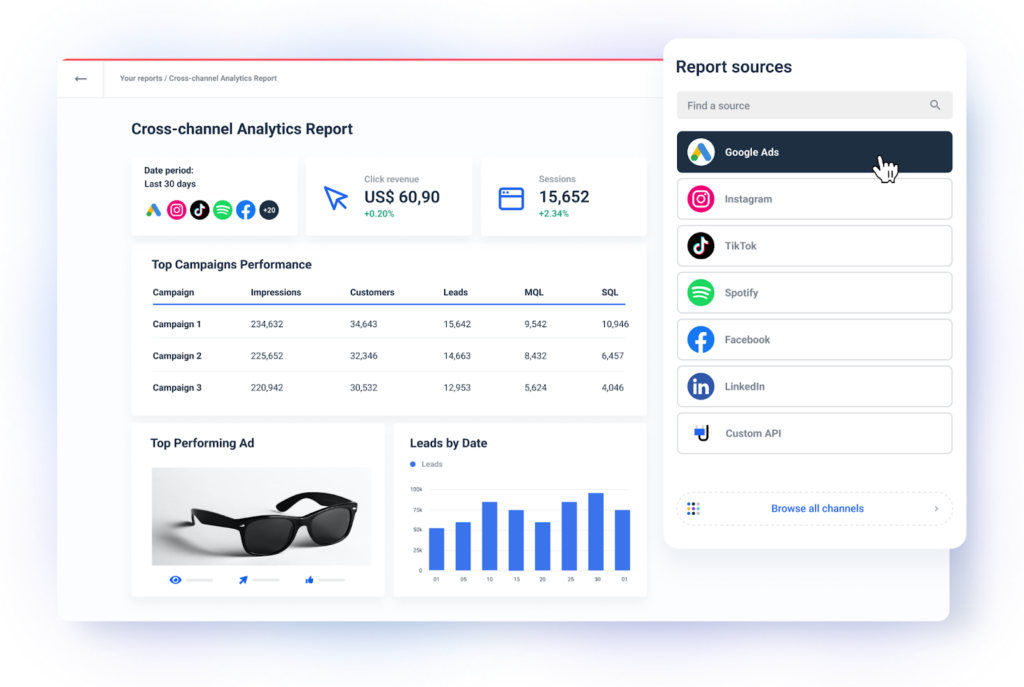
This report provides a holistic view of performance across platforms like Google Ads, Facebook, LinkedIn, SEO, and email.
Instead of jumping between tools or reports, clients see how all their marketing channels work together, and where the budget is driving the most impact.
Key Metrics to Include:
Customer acquisition cost (CAC): Helps determine how efficiently each channel is converting leads into customers. Lifetime value (LTV): Shows long-term value per customer, useful for understanding profitability by source. Cost per click (CPC) & conversion rate (CVR): Essential for paid media insights. Channel-specific ROI or ROAS: Aligns spend with real outcomes.How to Structure the Report:
Start with a visual summary showing top-performing channels and areas of concern. Follow this with channel-by-channel breakdowns, highlighting what worked, what didn’t, and why. End with actionable insights and recommendations.
Best Practices:
Many cross-channel reports fall short by focusing on data dumps over clarity. To make this type of report actually useful for clients, keep these expert recommendations in mind:
Lead with a plain-language performance summary. Start the report with a high-level overview: what happened this month, why it matters, and what actions are recommended. This helps clients who don’t understand CPCs and CTRs stay focused on big-picture results. On Whatagraph, you can get AI to generate these performance summaries in seconds based on your data and preferred time range. You can also fully edit these summaries to fit your brand tone and voice. Visualize performance clearly. Use bar charts, scorecards, and color-coded KPIs to highlight what’s performing well and what needs improvement—without making clients hunt for insights in spreadsheets. Group data logically. Structure the report with a clear flow: overview → individual channels (paid, organic, email, etc.) → recommendations. This makes it easier for clients to navigate and digest. Automate and brand your reports. Use a tool like Whatagraph to automatically pull in fresh data from all channels, apply your client’s branding, and ensure reports are delivered consistently, without hours of manual work. Use consistent KPIs across channels. This enables better apples-to-apples comparisons and helps identify where the budget should be reallocated. Include commentary at the end. Clients appreciate your expertise, add contextual notes explaining what changed, why it matters, and what’s being done about it. This turns a static report into a strategic conversation starter.2. SEO Performance Report
Best for: Tracking organic search performance over time and demonstrating the ROI of SEO initiatives.
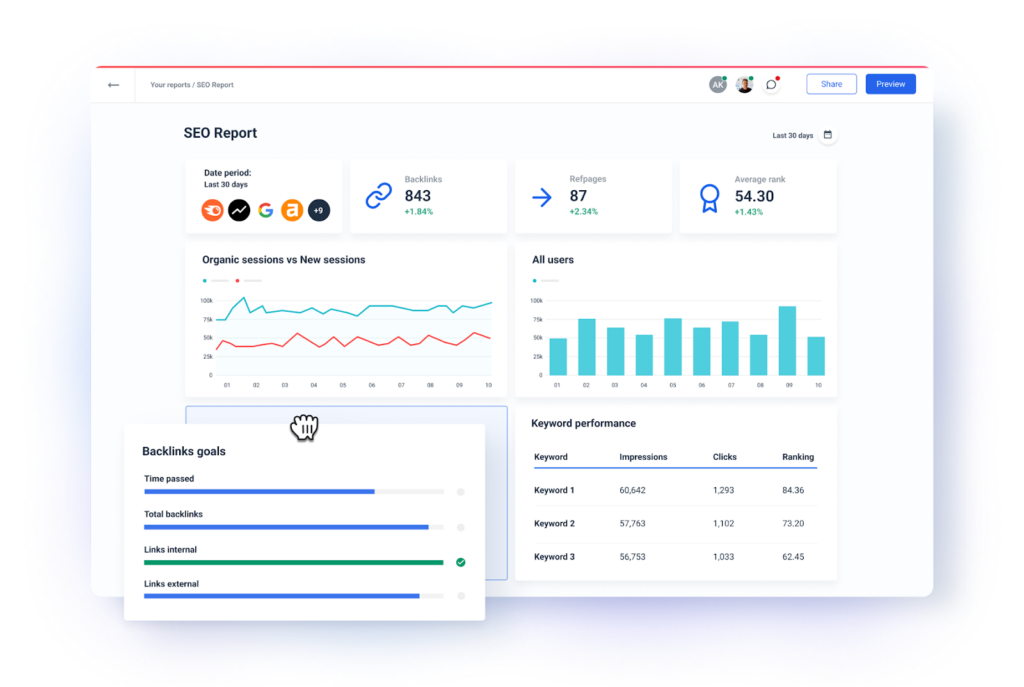
An SEO performance report shows clients how their search visibility is changing, and how that translates into meaningful outcomes like traffic, leads, or sales.
It connects the dots between keyword rankings, content efforts, and actual business growth.
Key Metrics to Include:
Organic traffic & sessions: Show how SEO drives discovery and engagement. Top-performing pages: Identify which content delivers results and why. Keyword rankings (tracked over time): Reveal movement on strategic terms. Click-through rate (CTR): Helps optimize meta content and SERP visibility. Bounce rate & time on page: Indicate content relevance and quality. Conversions from organic traffic: Tie performance to business outcomes.How to Structure the Report:
Start with a performance summary that highlights wins (e.g., traffic spikes, ranking jumps), followed by a breakdown of top pages and keyword groups. Conclude with opportunities, like pages to update, new content to create, or technical issues to fix.
Best Practices:
A good SEO report isn’t just a list of rankings, it’s a story about how visibility turns into value. Here’s how to make it work:
Show progress, not just position. Track keyword performance over time to highlight upward trends—even if your site hasn’t hit the #1 spot yet. Tie content to results. Highlight blog posts or landing pages that generated conversions or brought in qualified traffic. This connects your SEO work to business goals. Segment by intent. Group keywords by search intent (informational, navigational, transactional) to show how your content strategy covers the full funnel. Avoid data overload. Focus on the metrics that matter most to your client’s goals. For example, a B2B client may care more about organic lead gen than blog views. Add context and commentary. Explain why a page dropped in rankings or what’s driving a traffic spike. Clients don’t just want data, they want direction. Here again, you can get Whatagraph’s AI to write out performance summaries for you and edit them after. Make it skimmable. Use visuals and summary boxes to highlight key wins and action items. The goal is to help clients see results in seconds, not spend minutes searching for them.3. PPC Performance Report
Best for: Evaluating paid campaign performance and identifying opportunities to improve ROI and reduce wasted spend.
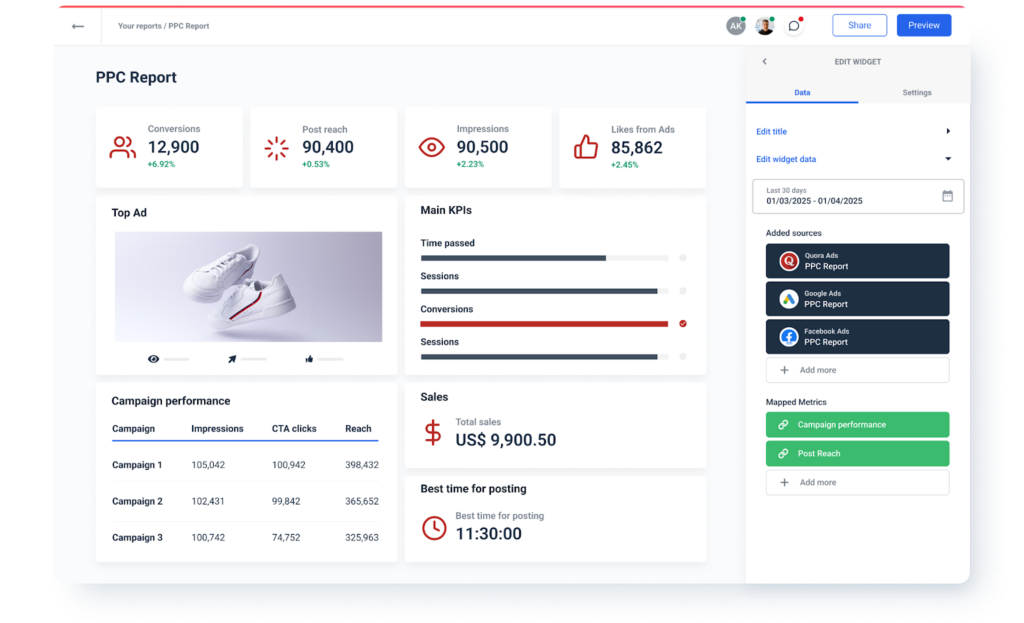
A PPC performance report helps clients understand where their ad budget is going, and what they’re getting in return.
Whether it’s Google Ads, Meta, LinkedIn, or other platforms, the goal is to surface what’s driving conversions, where spend is being wasted, and what optimizations are working.
Key Metrics to Include:
Impressions, clicks, and CTR: Top-level visibility into campaign reach and engagement. Cost per click (CPC): Measures advertising efficiency. Conversion rate (CVR): Helps track funnel effectiveness. Cost per acquisition (CPA): Shows how efficiently paid media is driving results. Quality Score (Google Ads): Indicates relevance and landing page quality. Top-performing ads or campaigns: Highlights creative and targeting wins.How to Structure the Report:
Start with an executive summary that outlines how the budget was spent and what outcomes it drove. Follow with platform-level breakdowns (Google Ads, Facebook Ads, etc.), and conclude with optimization insights—such as budget reallocations or A/B test results.
Best Practices:
A strong PPC report makes it easy for clients to see what returns they’re getting out of their investments in ads. Here’s how to ensure yours clearly show this ROI:
Focus on business outcomes, not just ad metrics. Tie campaigns to actual results like lead form submissions, purchases, or bookings—not just clicks or impressions. Group insights by platform. Create clear sections for Google, Meta, and other channels to help clients understand where each dollar is going and how each is performing. Use visuals to highlight key trends. Line charts, bar graphs, and annotated KPIs help make shifts in performance easy to spot at a glance. Include clear takeaways. Show what was tested, what worked, and what will be done next—turning data into direction. Report on experiments. If you tested new ad copy or targeting, include outcomes. This builds transparency and positions your agency as proactive and strategic. Automate the tedious parts. Whatagraph pulls ad performance data from all major PPC platforms into a single, white-labeled report—automatically updated, beautifully visualized, and easy for clients to understand. No spreadsheets, no broken dashboards.Best for: Measuring the effectiveness of content strategy, identifying high-performing posts, and uncovering engagement trends across social platforms.

An organic social media report tracks how well non-paid content performs across platforms like Instagram, LinkedIn, Facebook, TikTok, and X.
For clients investing in brand awareness, engagement, or community-building, this report shows what content is resonating and what’s not.
Key Metrics to Include:
Engagement rate: Combines likes, comments, shares, and saves relative to reach. Follower growth: Tracks how well the content attracts new audience members. Top-performing posts: Reveals what content themes or formats drive results. Reach and impressions: Offers visibility into how far your content is spreading. Click-throughs and conversions (if available): Shows if organic content is driving traffic or sales.How to Structure the Report:
Start with a summary of platform-wide performance—what’s up, what’s down, and why. Follow with post-level breakdowns and platform-specific insights. Close with content recommendations and next steps.
Best Practices:
Reporting on organic content shouldn’t just be about vanity metrics. Use these strategies to turn social data into strategic insight:
Add an executive summary. Begin with a concise, plain-language overview of performance: what improved, what didn’t, and key actions to take. This helps clients get the big picture without digging into charts. Compare platforms side by side. Help clients see which channels are growing fastest and where to double down or pull back. Contextualize engagement. A spike in comments on one post? Highlight why. Was it a new content format, a trending topic, or a change in posting time? Showcase top-performing posts. Don’t just report that a post performed well. Include a visual of it, explain why it worked, and suggest how to replicate its success. Whatagraph makes this easy by bringing in all your top-performing posts and the results they generated into one report. Tie engagement to brand goals. For B2B clients, engagement on thought leadership posts may matter more than follower growth. Always frame metrics around what the client actually values. Use consistent benchmarks. Compare current performance against the previous month or quarter, and flag significant shifts. On Whatagraph, you can build an internal performance monitoring dashboard—just for your team—where you can monitor these KPI shifts at all times.5. Monthly Marketing Summary Report

Best for: Recapping monthly performance, highlighting key wins and losses, and providing strategic direction across all active channels.
The monthly marketing summary report is the go-to format for giving clients a high-level view of all their marketing efforts in one place.
It combines performance data across channels—paid, organic, email, SEO, and more—into a clear, client-ready overview that drives strategy and decision-making.
Key Metrics to Include:
Overall traffic and conversions: Sets the baseline for performance. Channel-by-channel breakdowns: Highlights each channel’s contribution. Top campaigns or content assets: Demonstrates what’s working. Budget vs. performance: Shows whether spend is aligned with ROI. Month-over-month and YoY comparisons: Tracks trends over time. Next steps and recommendations: Provides direction, not just reflection.How to Structure the Report:
Start with a clean executive summary—what worked, what didn’t, and what’s next. Then walk through each channel briefly, pulling out highlights and issues. End with insights and action steps, tailored to client goals.
Best Practices:
This is the report that your clients will use as a single source of truth, so it needs to be strategic, polished, and immediately valuable. Here’s how to nail it:
Lead with insights. Put the “so what?” front and center. Clients don’t want to hunt for meaning—they want to know what changed and why it matters. Balance visuals and commentary. Use visuals for key metrics and trends, but always include short explanations. This turns a static report into a strategic conversation. Connect data to goals. Tie results to KPIs the client cares about—like lead quality, sales, or retention—not just surface-level metrics like clicks or likes. Highlight momentum. Use MoM and YoY trends to frame wins and losses. A dip in traffic might not be a red flag if conversions are up. Summarize wins clearly. Include a “Top 3 wins” and “Biggest opportunity” section for a fast, skimmable snapshot of what matters most.Final Thoughts
At the end of the day, a great marketing report doesn’t just show data, it tells a story that drives decisions.
Whether you’re reporting on SEO, PPC, email, or social, the same principles apply:
Focus on outcomes that matter Make insights clear and actionable Visualize results in a way that’s easy to understand Automate the process so reporting doesn’t eat up your weekWhen your reports are easy to read, impossible to ignore, and clearly tied to growth—you build trust, reduce churn, and prove your value.


-1.png)