Fantom Q2 Performance: Financial Metrics React To Sonic Blockchain Anticipation
The Fantom blockchain saw mixed performance in the second quarter (Q2) of the year, with key financial metrics cooling amid the broader cryptocurrency market downturn and the Fantom Foundation’s announcement to rebrand as Sonic Labs, according to a new...

The Fantom blockchain saw mixed performance in the second quarter (Q2) of the year, with key financial metrics cooling amid the broader cryptocurrency market downturn and the Fantom Foundation’s announcement to rebrand as Sonic Labs, according to a new report from data intelligence firm Messari.
FTM Market Cap, Revenue, And Token Economics
After outperforming in Q1, Fantom’s circulating market cap decreased 41% quarter-over-quarter (QoQ) from $2.8 billion to $1.7 billion. However, the token’s market cap is still 94% higher year-over-year (YoY) compared to Q2 2023.
 Fantom’s market cap decrease. Source: Messari
Revenue, which measures gas fees collected by the network, fell 42% QoQ from 1.8 million FTM to 1.0 million FTM. In USD terms, revenue decreased 38% QoQ from $1.2 million to $0.8 million.
This decline follows a spike in Q3 2023 due to activity around non-fungible token (NFT) inscriptions, but according to Messari, revenue is expected to rebound as on-chain activity picks up across the broader crypto space.
The report also highlights changes to Fantom’s token economics during the second quarter. The Ecosystem Vault and Gas Monetization program were introduced in Q4 2022, reducing the burn rate of transaction fees from 30% to 5% and reallocating the remaining 25%.
By the end of the second quarter, the circulating supply of the protocol’s native token FTM reached 2.8 billion, with an annualized inflation rate of 3% – up 25% quarter-over-quarter.
Fantom On-Chain Activity Slows
Fantom’s on-chain activity also trended lower in Q2. Daily transactions averaged over 223,000, down 10% QoQ from 247,000. Daily active addresses fell 21% QoQ to 31,900, though the report notes a reversal of this trend towards the end of the quarter.
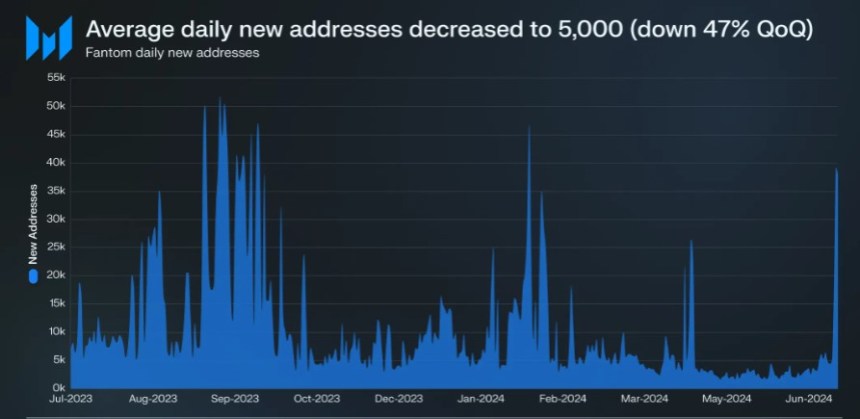
New address growth also slowed, dropping 47% QoQ to 5,000 per day on average. However, the report highlighted some positive developments, including an increase in the number of active validators on the network.
 Fantom’s new addresses fluctuations in Q2. Source: Messari
After a governance proposal reduced the staking requirement from 500,000 FTM to 50,000 FTM, the number of active validators grew 6% QoQ to 58, with 14 having less than 500,000 FTM self-staked.
Staked FTM also saw inflows for the second straight quarter, increasing 5% QoQ to 1.3 billion tokens. But the total dollar value of staked FTM decreased 39% QoQ to $780.4 million due to the token’s price depreciation.
Fantom’s total value locked (TVL) in decentralized finance (DeFi) applications decreased 28% QoQ to $91.2 million, ranking it 42nd among blockchain networks. However, TVL denominated in FTM increased 22% QoQ, suggesting capital inflows despite the token’s price decline.
At the time of writing, FTM was trading at $0.3345, up just 1% over the past 24 hours. In the monthly time frame, the coin is down 27% over the past month amid the broader market decline.
Featured image from Shutterstock, chart from TradingView.com

 Fransebas


