How to Create a KPI Report Step by Step
What is a KPI Report? A KPI report is a business-performance tool that tracks a company’s progress towards specific goals. Marketers usually create these summary reports on Excel or automated reporting tools like DashThis. Note how the latter turns...

What is a KPI Report?
A KPI report is a business-performance tool that tracks a company’s progress towards specific goals.
Marketers usually create these summary reports on Excel or automated reporting tools like DashThis. Note how the latter turns key performance indicators into eye-catching charts and graphs.
If you were to review this KPI report with stakeholders in a decision-making meeting, you can quickly assess the ROI of your marketing efforts in a specific time frame and decide what needs to be done to optimize future campaigns.
How to Choose Your KPIs
It can be confusing selecting the right KPIs.
With a gazillion marketing to-dos on your list, how do you know which KPIs to focus on? Which KPIs drive actual results for the business?
Successful KPI reporting starts with taking a hard look at your pivoted business objectives, defining your outcome, and working backwards.
Let’s say you want to keep customers in a B2B SaaS startup.
You might set your business goals using the SMART framework (note: SMART is an acronym for specific, measurable, attainable, relevant, and time-bound. For any marketer who wants to track actionable markers of progress, this is the best approach).
Here’s how it might look like:
Reduce annual churn rate to 7% (specific) by Q4 2022 (time-bound) to retain customers (relevant). Our revenue marketing team will review the following onboarding metrics in a KPI dashboard weekly (attainable): time-to-complete onboarding, time-to-first-time value, and free-to-paid conversion (measurable).
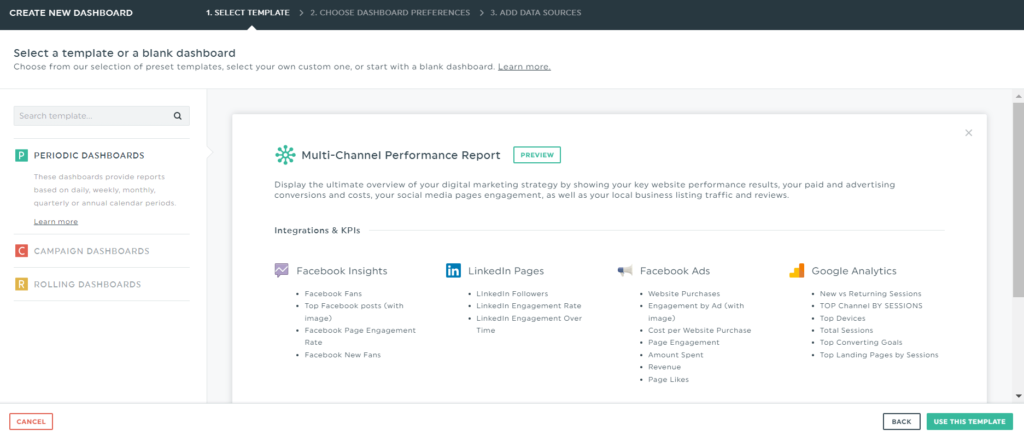
If you’re still unsure which KPIs to focus on, use the free templates in your KPI management tool. Here’s a multi-channel performance report from DashThis with built-in KPIs channels like from Facebook Insights and Google Analytics.
 Source: DashThis
These preset widgets are set up based on the most commonly used metrics, so you can always rest assured you’re tracking the right KPIs for your strategic goals.
Why are KPI Reports Important?
KPI reports, especially those that sport interactive dashboards, help us gain insights at a single glance.
Instead of clicking from one channel to another, we bring all data to one place to create a holistic view of all campaigns. This is important if your clients are senior management or busy business owners who only care about the big picture.
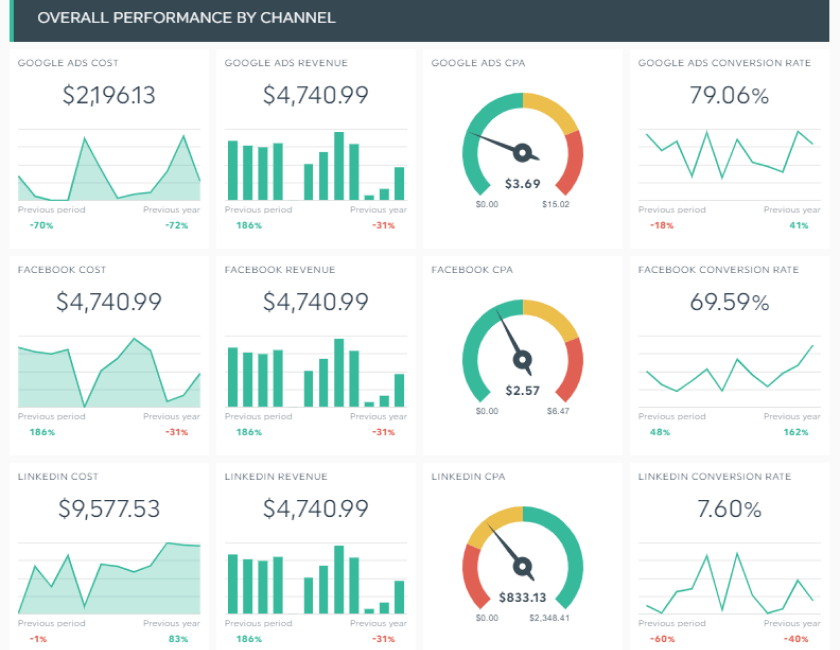
Note this multi-channel KPI template that combines the overall performance of advertising channels, Google Ads, Facebook Ads, and LinkedIn Ads.
 Source: DashThis
From a quick glance, we can see that the ads on LinkedIn perform the worst. With this new information, we might stop promoting on LinkedIn and allocate its ad budget to Google and Facebook for the next period.
KPI reports set meaningful goals and benchmarks. Without them, we have no way of knowing what’s working (and what’s not) in our marketing efforts.
KPI Report Templates and Examples
And now, for the good stuff. Here are three popular KPI report examples if you’re unsure which important metrics you should track today.
KPI Report Template
 Source: DashThis
Few businesses have cracked SEO, and it’s not hard to see why. With over a billion websites competing for the top spot, competition is as stiff as ever.
And it’s all the more reason to monitor your keyword rankings as you continue publishing online. You don’t want to keep creating new posts and going after keywords that clearly don’t work in your favor.
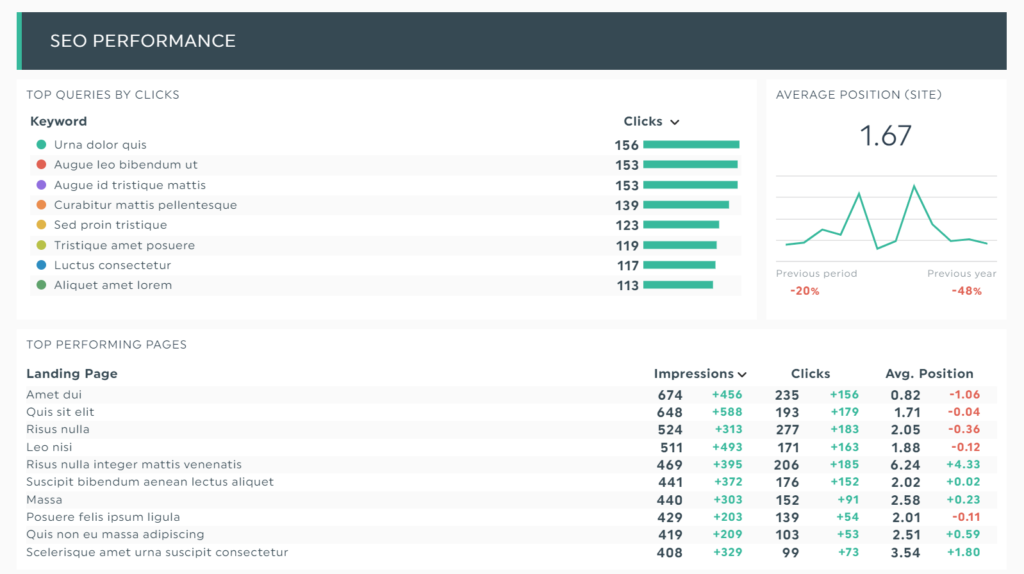
Note how the SEO and backlinks template from above shows the specific KPIs in a cohesive look. The metric, top-performing pages, is exceptionally helpful as it tells you right off the bat which ones are worth optimizing.
Digital Marketing Report Template
 Source: DashThis
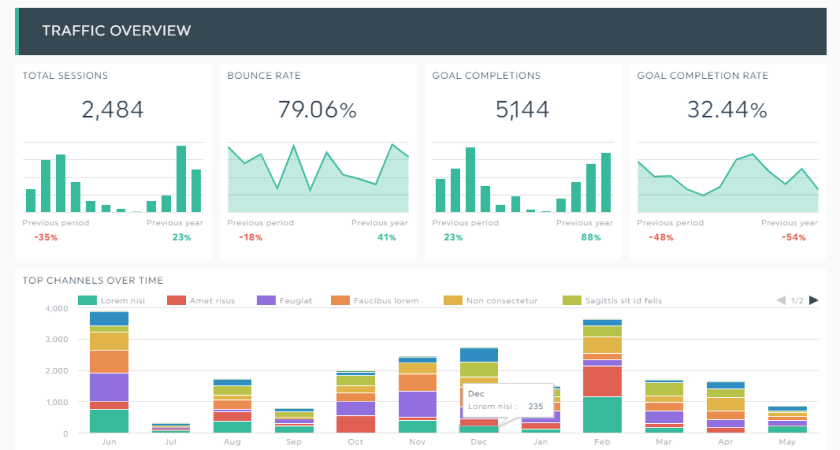
A PPC and SEO report aligns both channels, eliminates silos, and optimizes your overall digital marketing performance. In this digital marketing template, note how each particular KPI plays a significant role in traffic and the leads you acquire.
Whether your goal is to apply PPC conversion insights to your SEO hub-and-spoke content strategy, avoid keyword traps and better understand the intent behind your search queries, or boost rankings for your most profitable keywords, you can’t go wrong with this template.
PPC Report Template
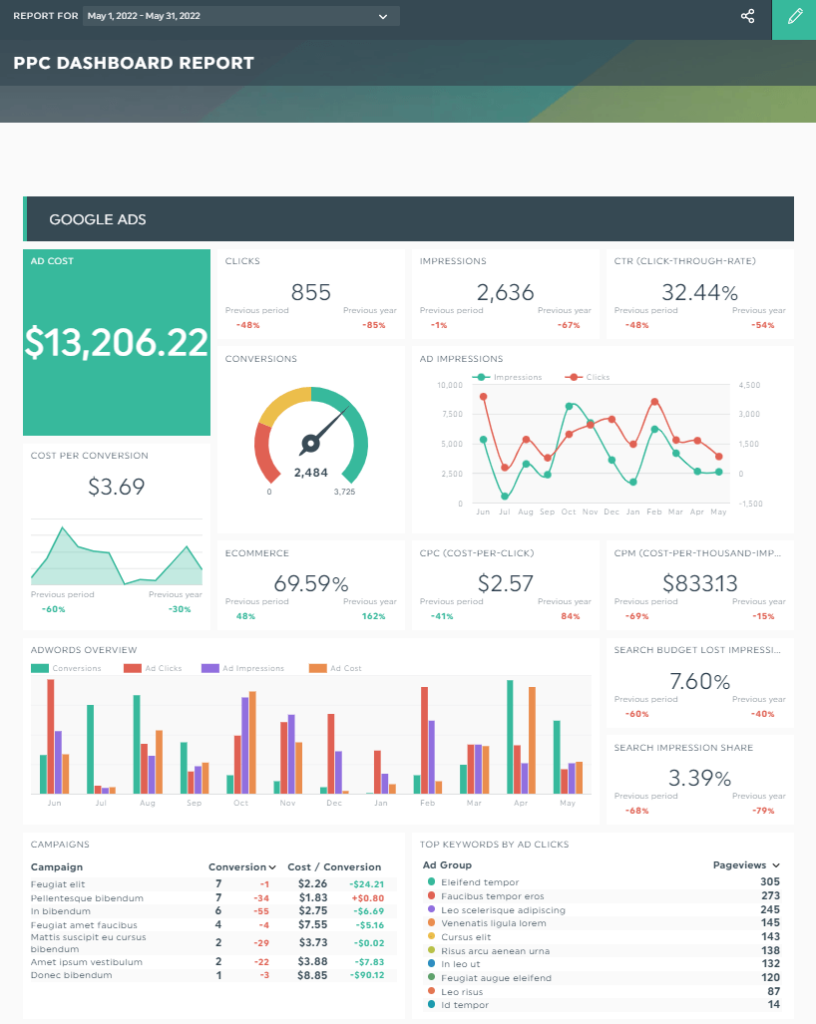 Source: DashThis
PPC is an exorbitant marketing pursuit that only the well-funded dare to go after—or so they say. In this PPC report template, we see a Google Ads breakdown down to the nitty gritty (e.g., cost per conversion, click-through rate).
This dashboard is the first place to look at if you want to optimize your PPC ads for greater sales growth. For instance, the metric, top keywords by ad clicks, helps you uncover your “money” keywords, improving your ad campaigns rapidly.
How to Create the Perfect KPI Report
KPI monitoring is one of the first few steps to achieving your business goals.
At this stage, use a reporting tool to track your metrics automatically. This allows you to save time, improve productivity, and focus on the best KPIs that drive exponential growth for the business.
Here’s how you can create a powerful KPI report on DashThis:
Pick a KPI report from 30+ free templatesConnect your favorite marketing tools Select your metrics under Preset Widgets (note: all popular metrics are pre-selected by the experts on DashThis)Drag and drop the metrics as you desire. DashThis will grab the data automatically from the selected channels and include them in your new KPI report.
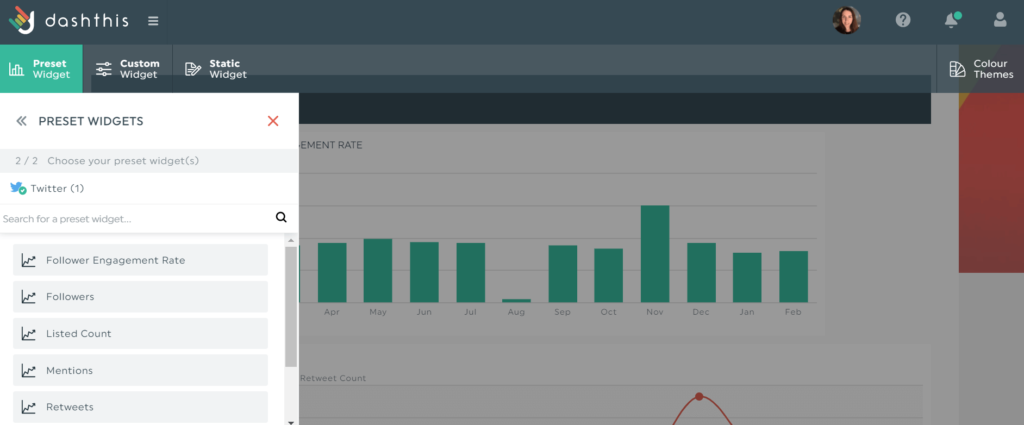 Source: DashThis
Next, include notes within the KPI report to provide additional context. This is helpful if you want to explain an erratic graph or if you’re working with a client with zero digital marketing expertise.
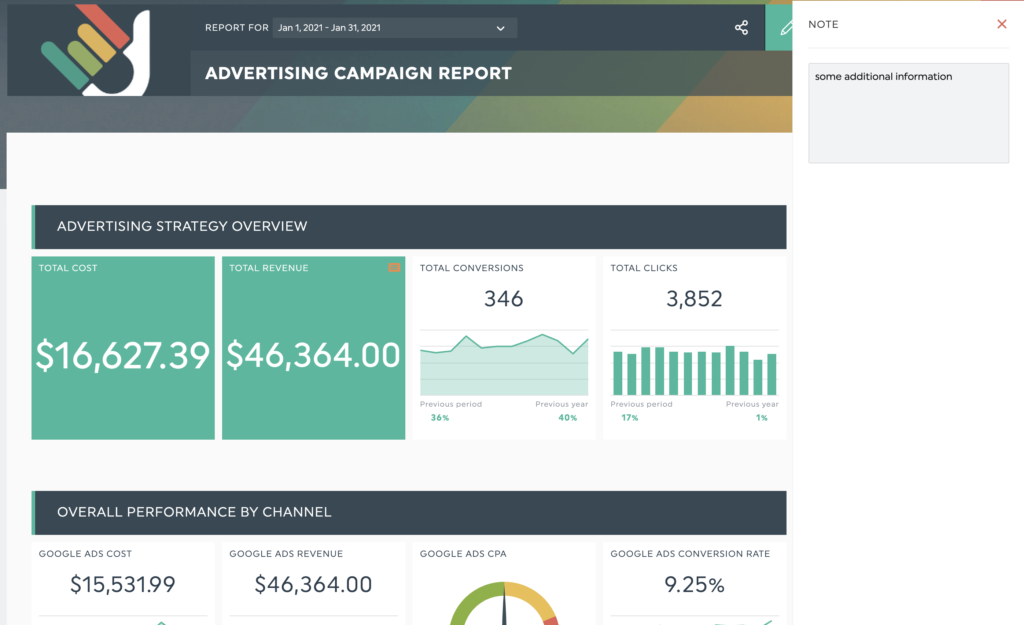 Source: DashThis
Your note will appear next to the widget as an orange tab in view mode. The recipient (i.e., project manager, client) can click to read it without leaving the DashThis platform.
You can also add comments at the end (or beginning) of the report to recommend the next steps for the next period. And while you’re at it, add images or screenshots to back up your recommendations.
 Source: DashThis
Once you’re satisfied with the KPI report, share it with stakeholders. Either download it as a PDF, grab a shareable URL link to provide them with real-time access, or schedule it as an automatic email dispatch.
With the auto email dispatch, select the dashboard period and frequency, and add a quick note to summarize what the report entails. After you click send, the recipient will receive an email that looks like this:
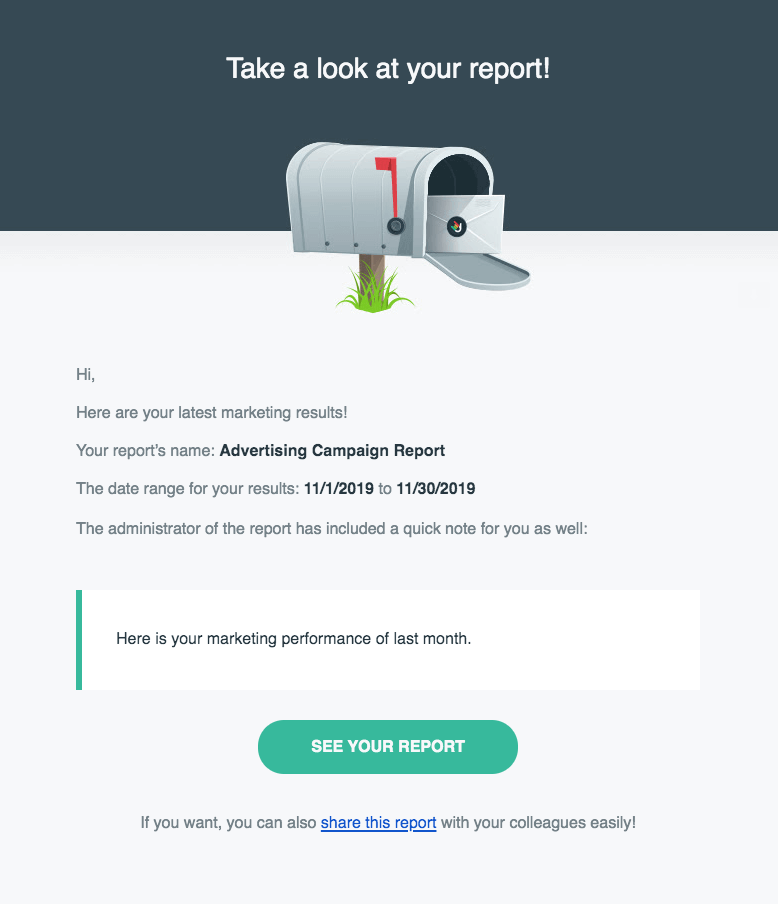 Source: DashThis
The automated KPI report acts as the starting point of every marketing campaign. It streamlines your workflow, creates a stellar experience for clients, and gains back hours of your time.
DashThis is an automated marketing reporting tool that gathers all your marketing data in one beautiful dashboard.
Start your 15-day free trial on DashThis to automate your KPI reporting today.

 Fransebas


