Polkadot (DOT) Poised For Rally? Analyst Predicts $9.00 Breakout
Resilient and showing great upward momentum is Polkadot (DOT), the blockchain network noted for its emphasis on interoperability. Polkadot has maintained its ground at the $6.30 support level thus far, indicating a solid basis for next developments. Related Reading:...

Resilient and showing great upward momentum is Polkadot (DOT), the blockchain network noted for its emphasis on interoperability. Polkadot has maintained its ground at the $6.30 support level thus far, indicating a solid basis for next developments.
DOT saw a little increase of 1.6% during the previous week, which experts think may be the forerunner to a much more significant upswing. Both experts and investors have drawn attention to this favorable situation, which will help Polkadot to have a possibly interesting future.
Polkadot Makes Steady Climb
Polkadot’s latest pricing forecasts present a hopeful picture. Forecasts show that DOT’s price may climb impressively by 227%, maybe reaching $20.69 by August 2024. Although the technical indicators reflect a neutral attitude right now, the Fear & Greed Index, at 74 (Greed), shows great market interest.
Polkadot has earned a 53% rate of green days over the previous 30 days with a little price volatility of 4.08%. Given the general positive attitude of the market, this data points to now as a good time to invest in DOT.
 Source: CoinCodex
Technical Patterns
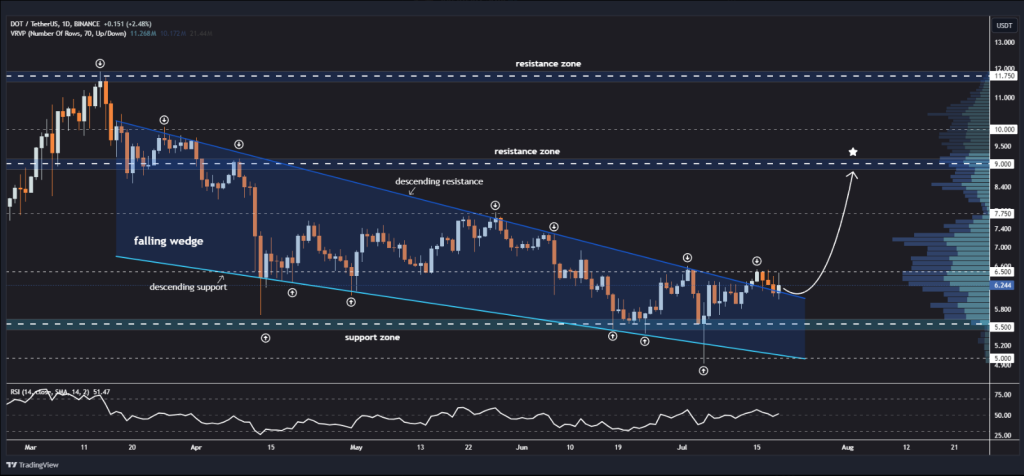
Prominent crypto expert Jonathan Carter has lately presented Polkadot with an encouraging prediction. Carter’s study centres on a notable technical advance: Recently, DOT broke out in a falling wedge pattern, a configuration sometimes taken as a positive indicator.
Polkadot broke out of falling wedge pattern and currently retested upper border💁♂️
Price might reach targets at $6.50, $7.75 and $9.00 after successful bounce in the next bullish wave🌊 pic.twitter.com/SZmbkEtExp
— Jonathan Carter (@JohncyCrypto) July 19, 2024
Usually indicating a period of consolidation followed by a breakout, this pattern is defined by converging trendlines. Carter claims that DOT has effectively crossed the top border of this pattern, therefore enabling possible upward momentum.

The coin’s price movement has been pushing this upper limit, a vital level that would guide its future action, after the breakthrough. Carter expects numerous possible pricing goals if DOT can keep its upward momentum and rebound off this important level.
In particular, he forecasts DOT may reach $6.50, $7.75, and maybe even $9.00 in the next bullish wave. As investors monitor Polkadot to keep its increasing trend, this prognosis has strengthened their trust even further.
A Strong Base For Next Development
Polkadot’s pricing right now according to the most recent market report is $6.29. With a trading volume of $382.82 million and a market capitalisation of $6.21 billion, the altcoin has appreciated 2% during the previous 24 hours. This price fluctuation underlines Polkadot’s increasing appeal for future performance based on increasing confidence.
With 63% of the market rating Polkadot as “Neutral Bullish,,” the opinion towards the company is now very good. Reflecting a score of 60 (Greed), the Fear & Greed Index shows that market players are growingly convinced in Polkadot’s future. This optimistic attitude is essential as it shows continuous investor interest, which is probably going to propel more price rises.
Polkadot’s latest performance and technological study point to its being in a prime for notable expansion. DOT might shortly soar with great support at $6.29 and optimistic forecasts from analysts like Jonathan Carter.
DOT is one of the interesting investment prospects as the market of cryptocurrencies develops. Both investors and aficionados will be attentively observing its transformation and looking forward the possibility for notable increases in the coming weeks.
Featured image from Mudrex, chart from TradingView

 BigThink


