Share of Search: How to Calculate, Use, And Improve It
For example, let’s say your brand gets 20,000 searches in a month, and your three main competitors get 15,000, 10,000, and 5,000 searches, respectively. The total branded search volume in your category is 50,000. To calculate your share of...
 JaneWalter
Article Performance
Data from Ahrefs
The number of websites linking to this post.
This post's estimated monthly organic search traffic.
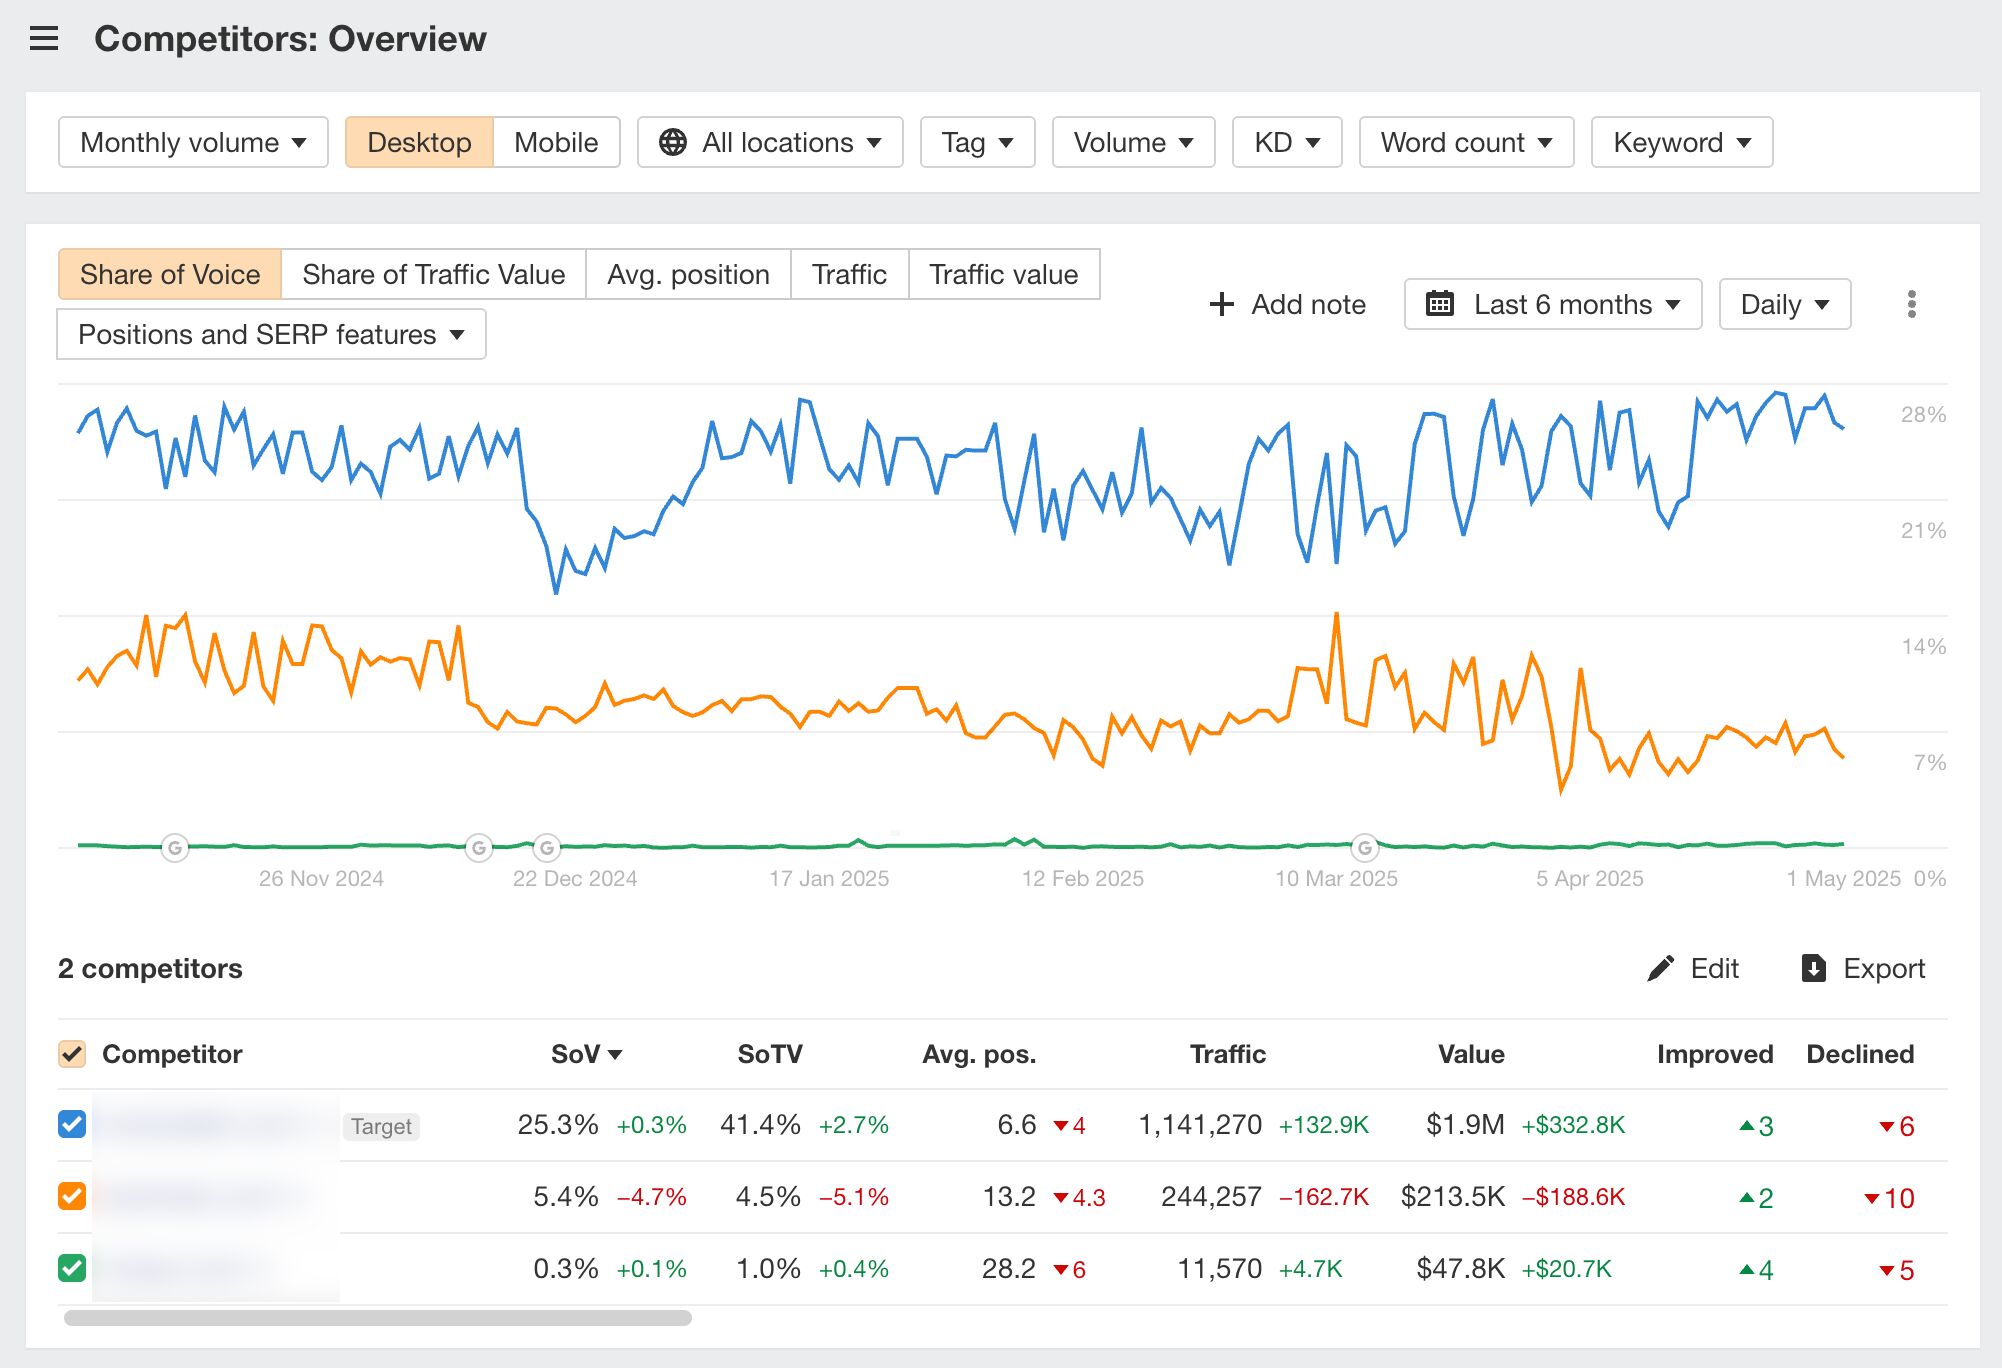
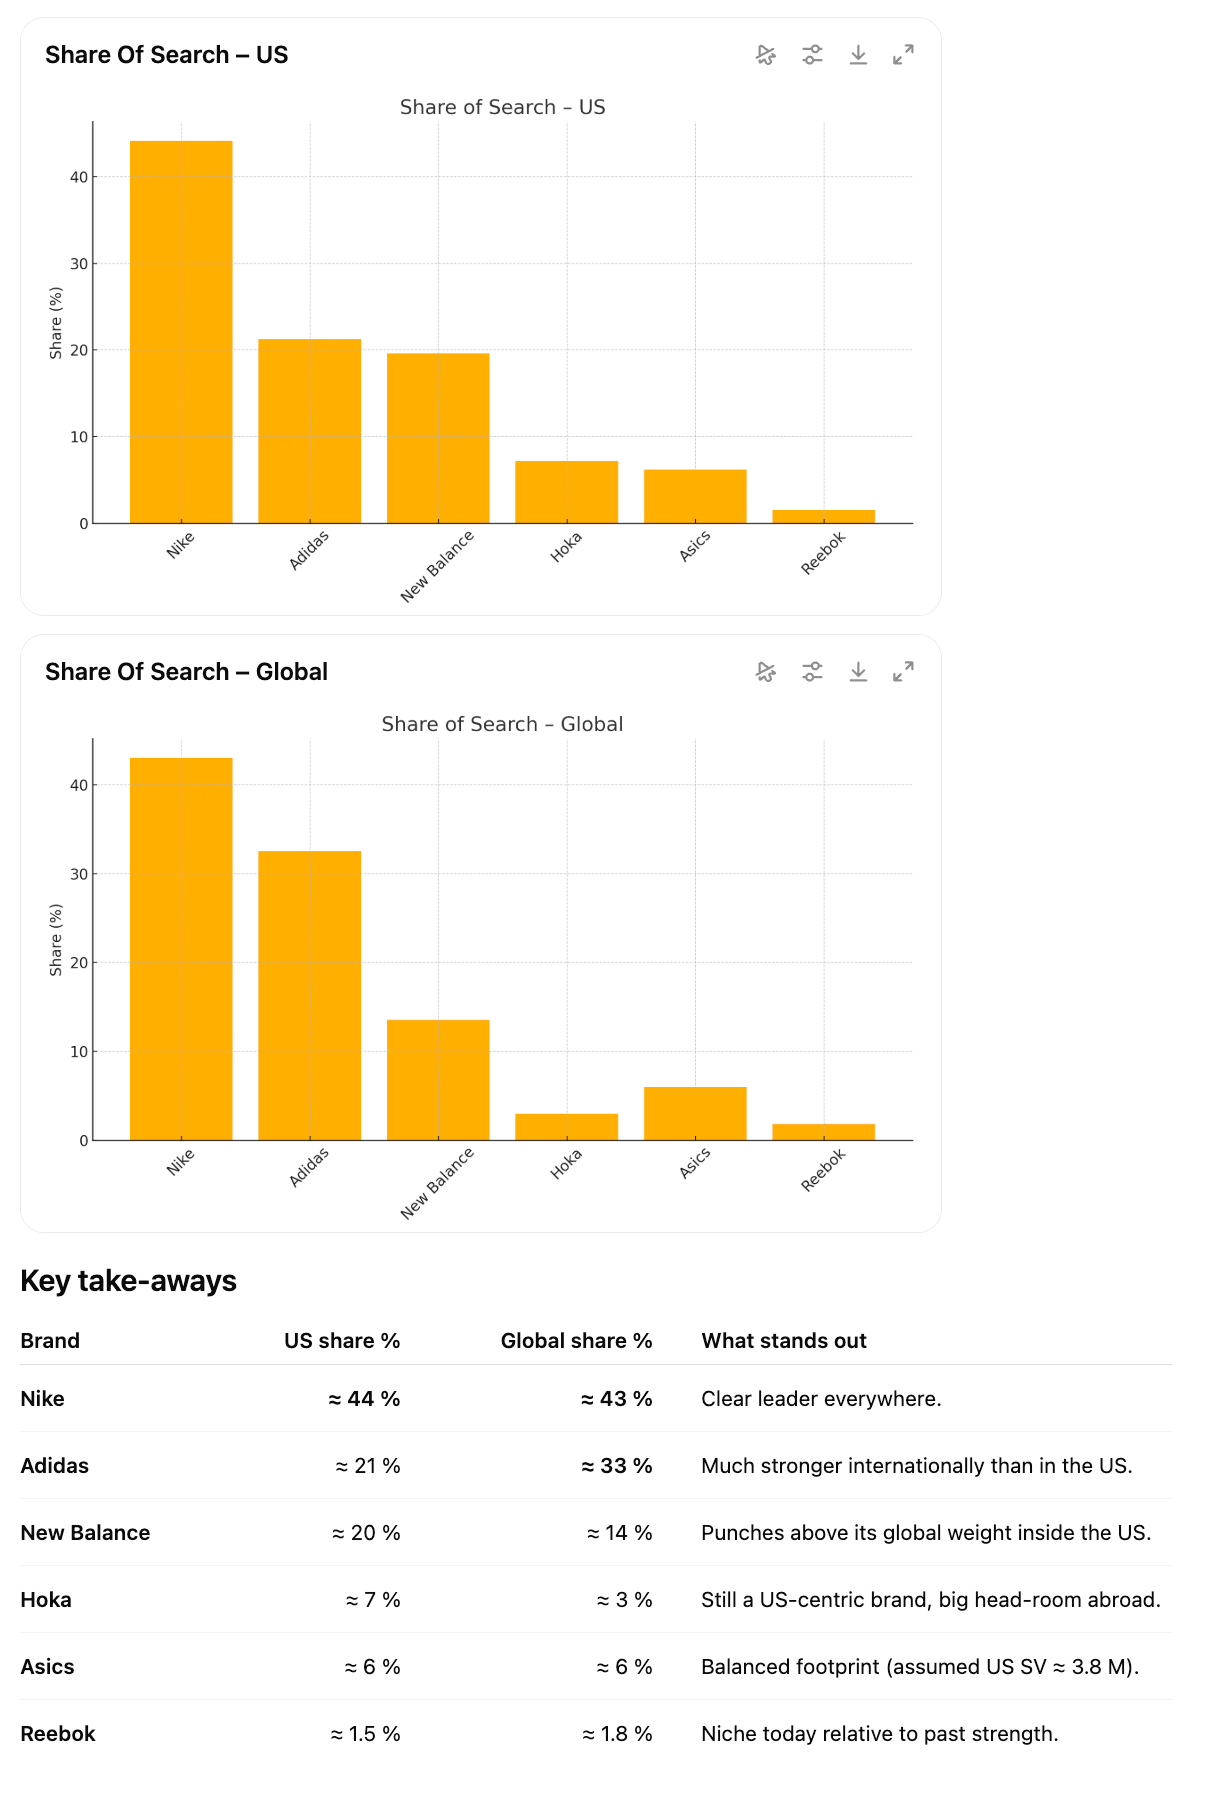
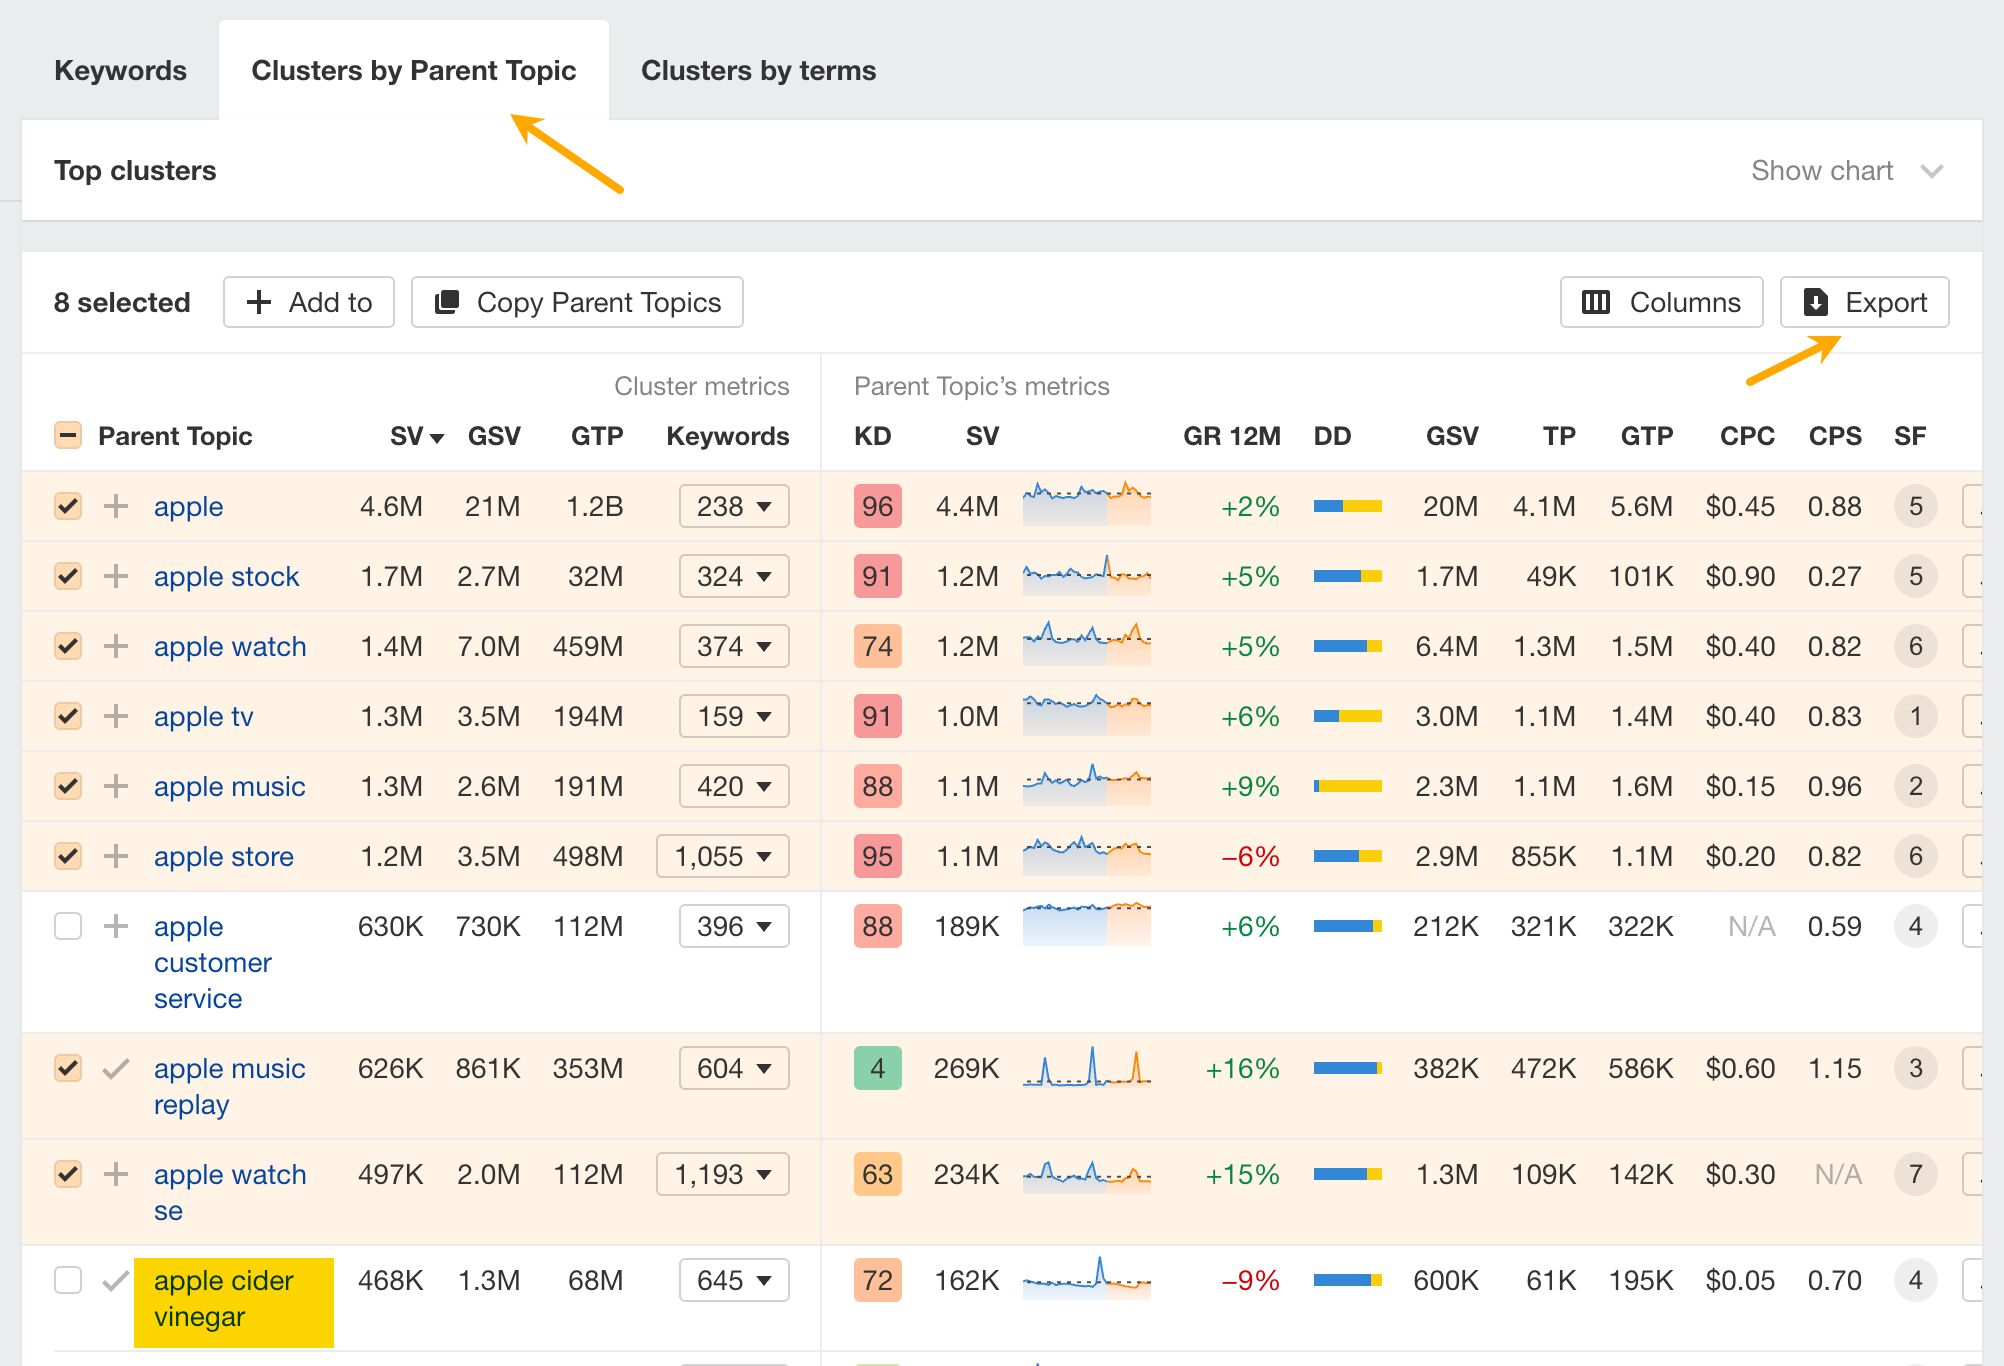
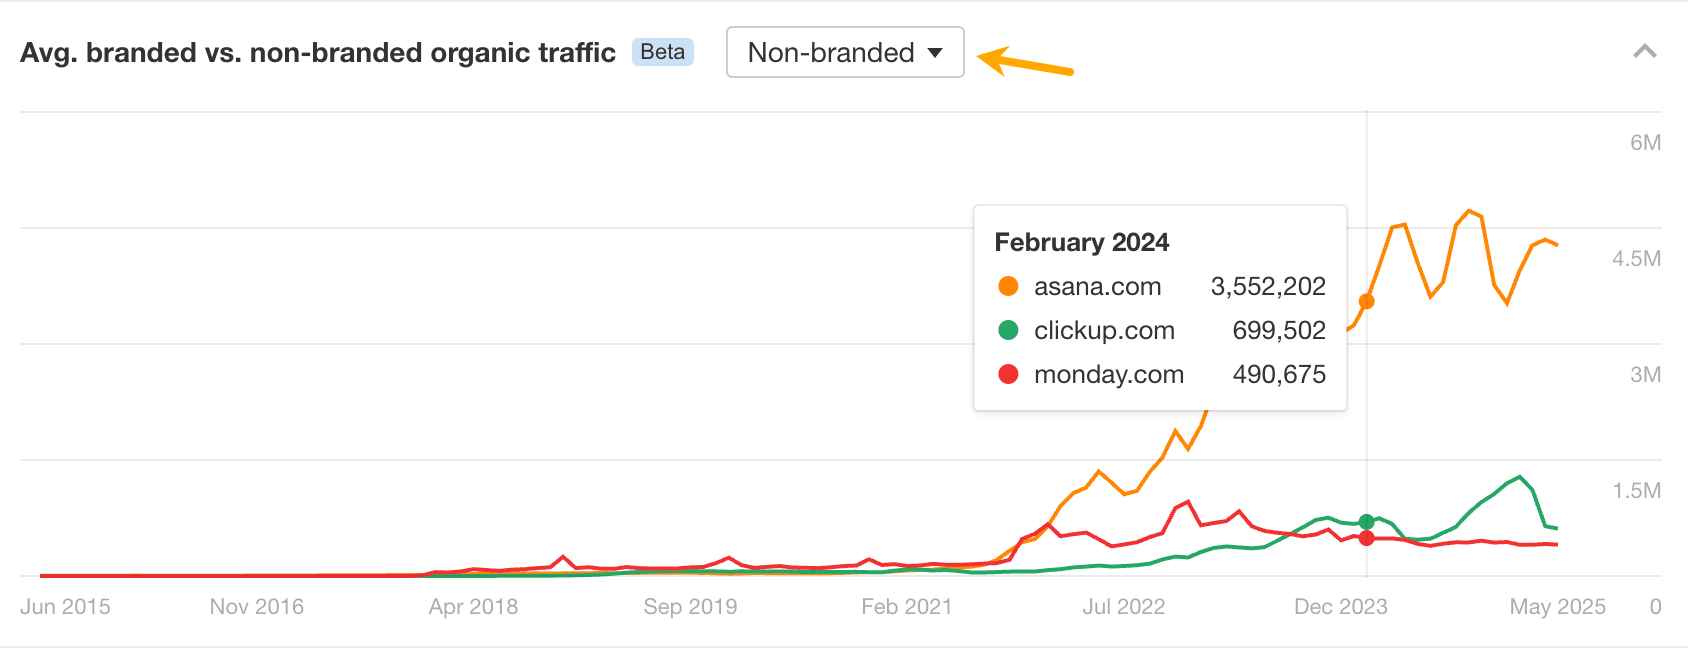
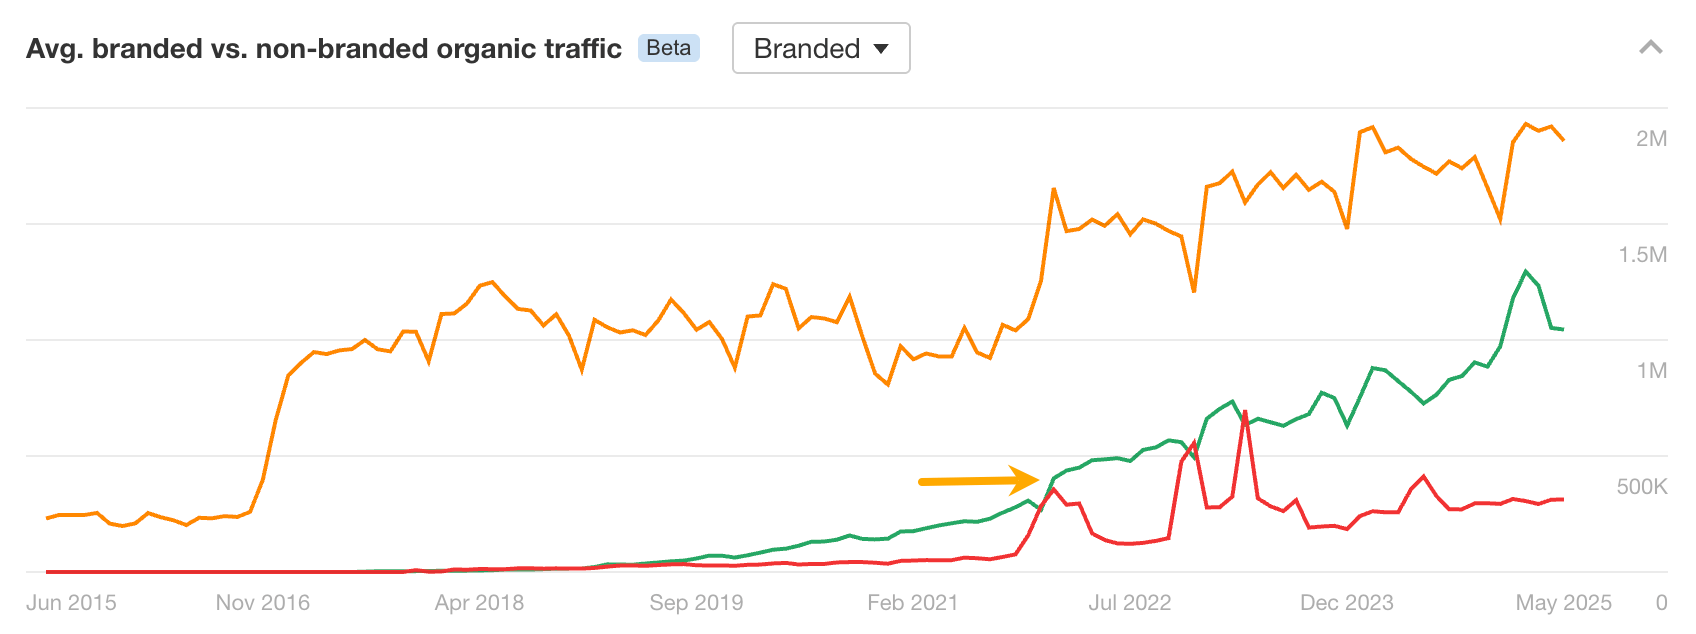
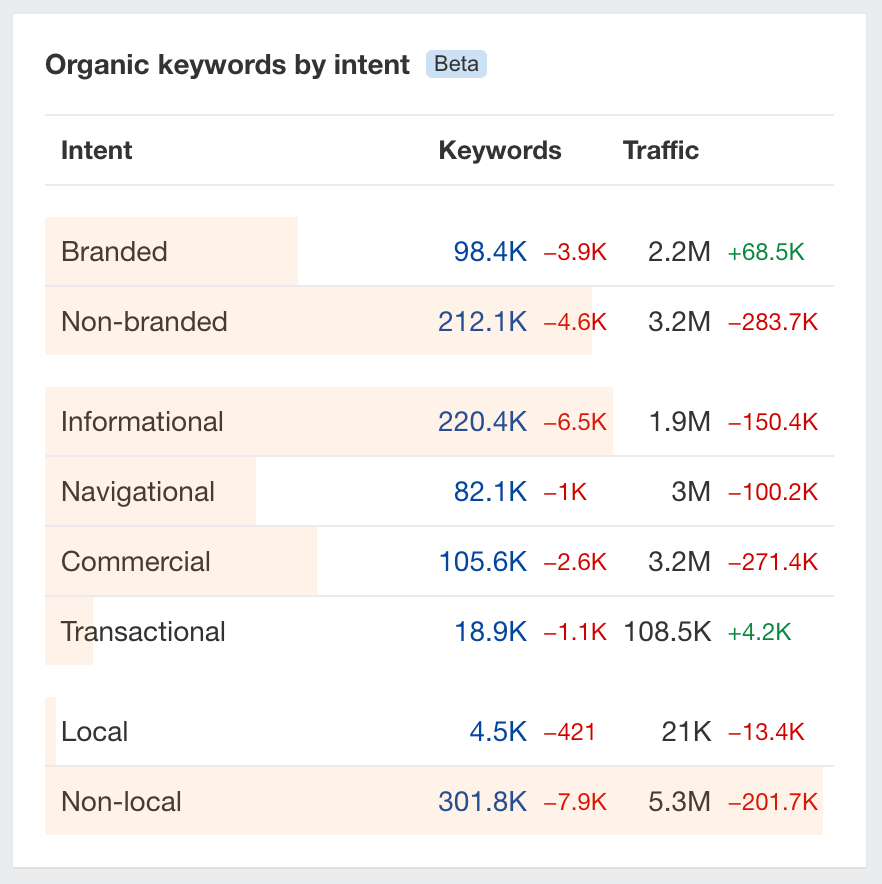
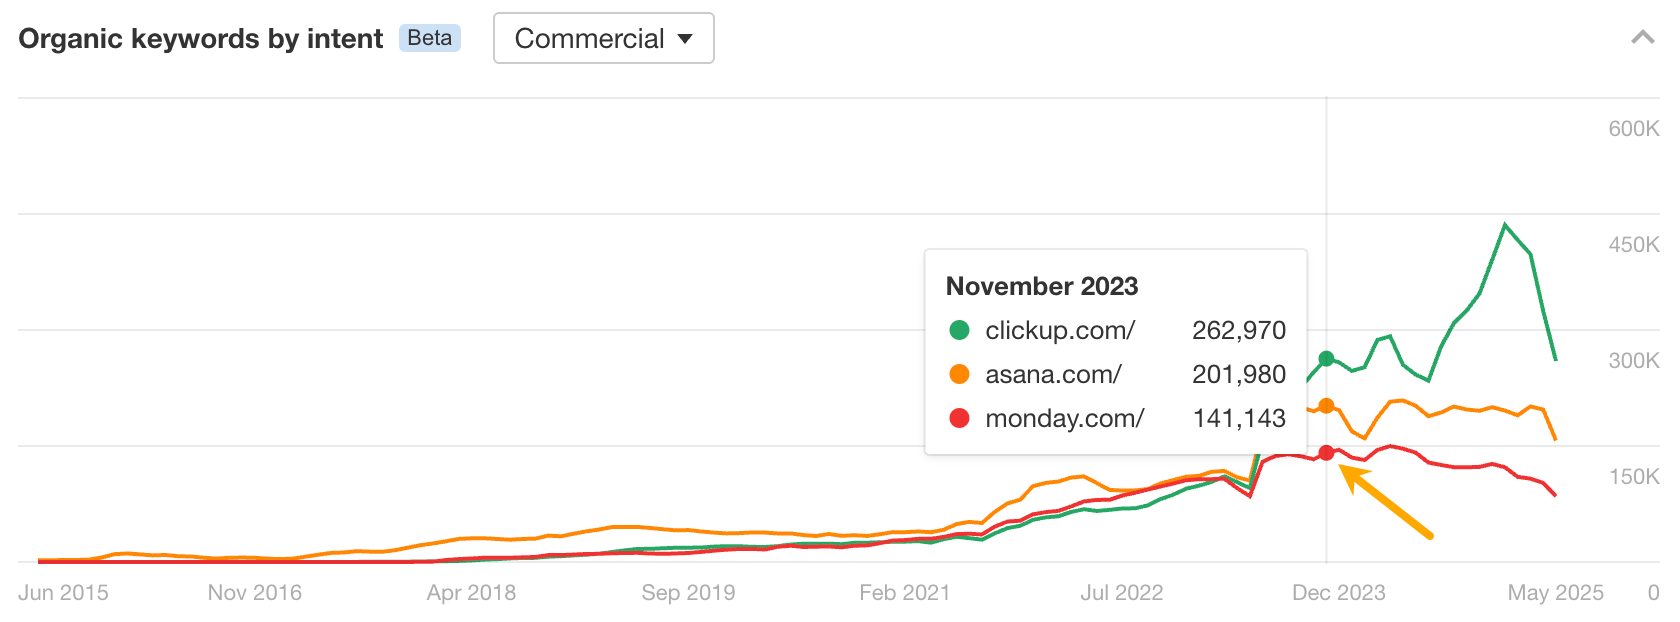
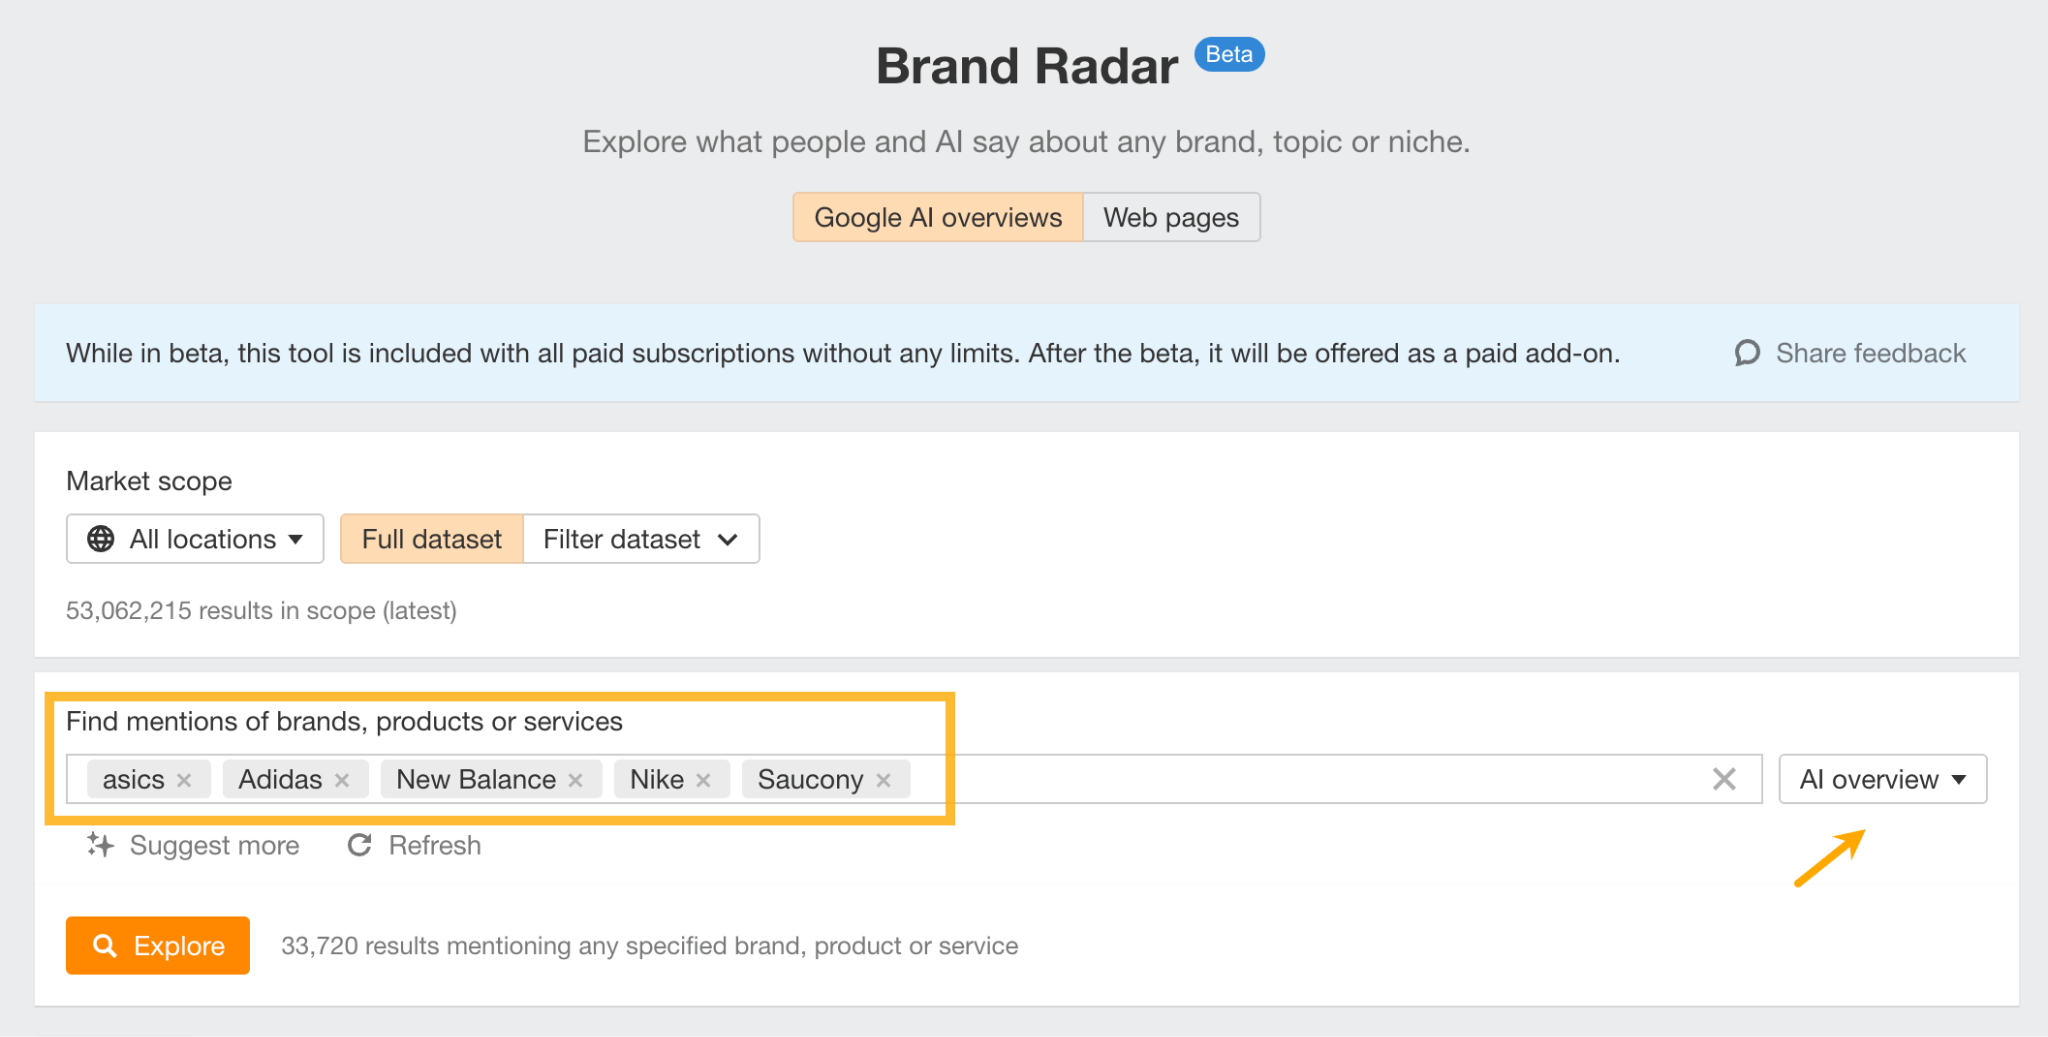
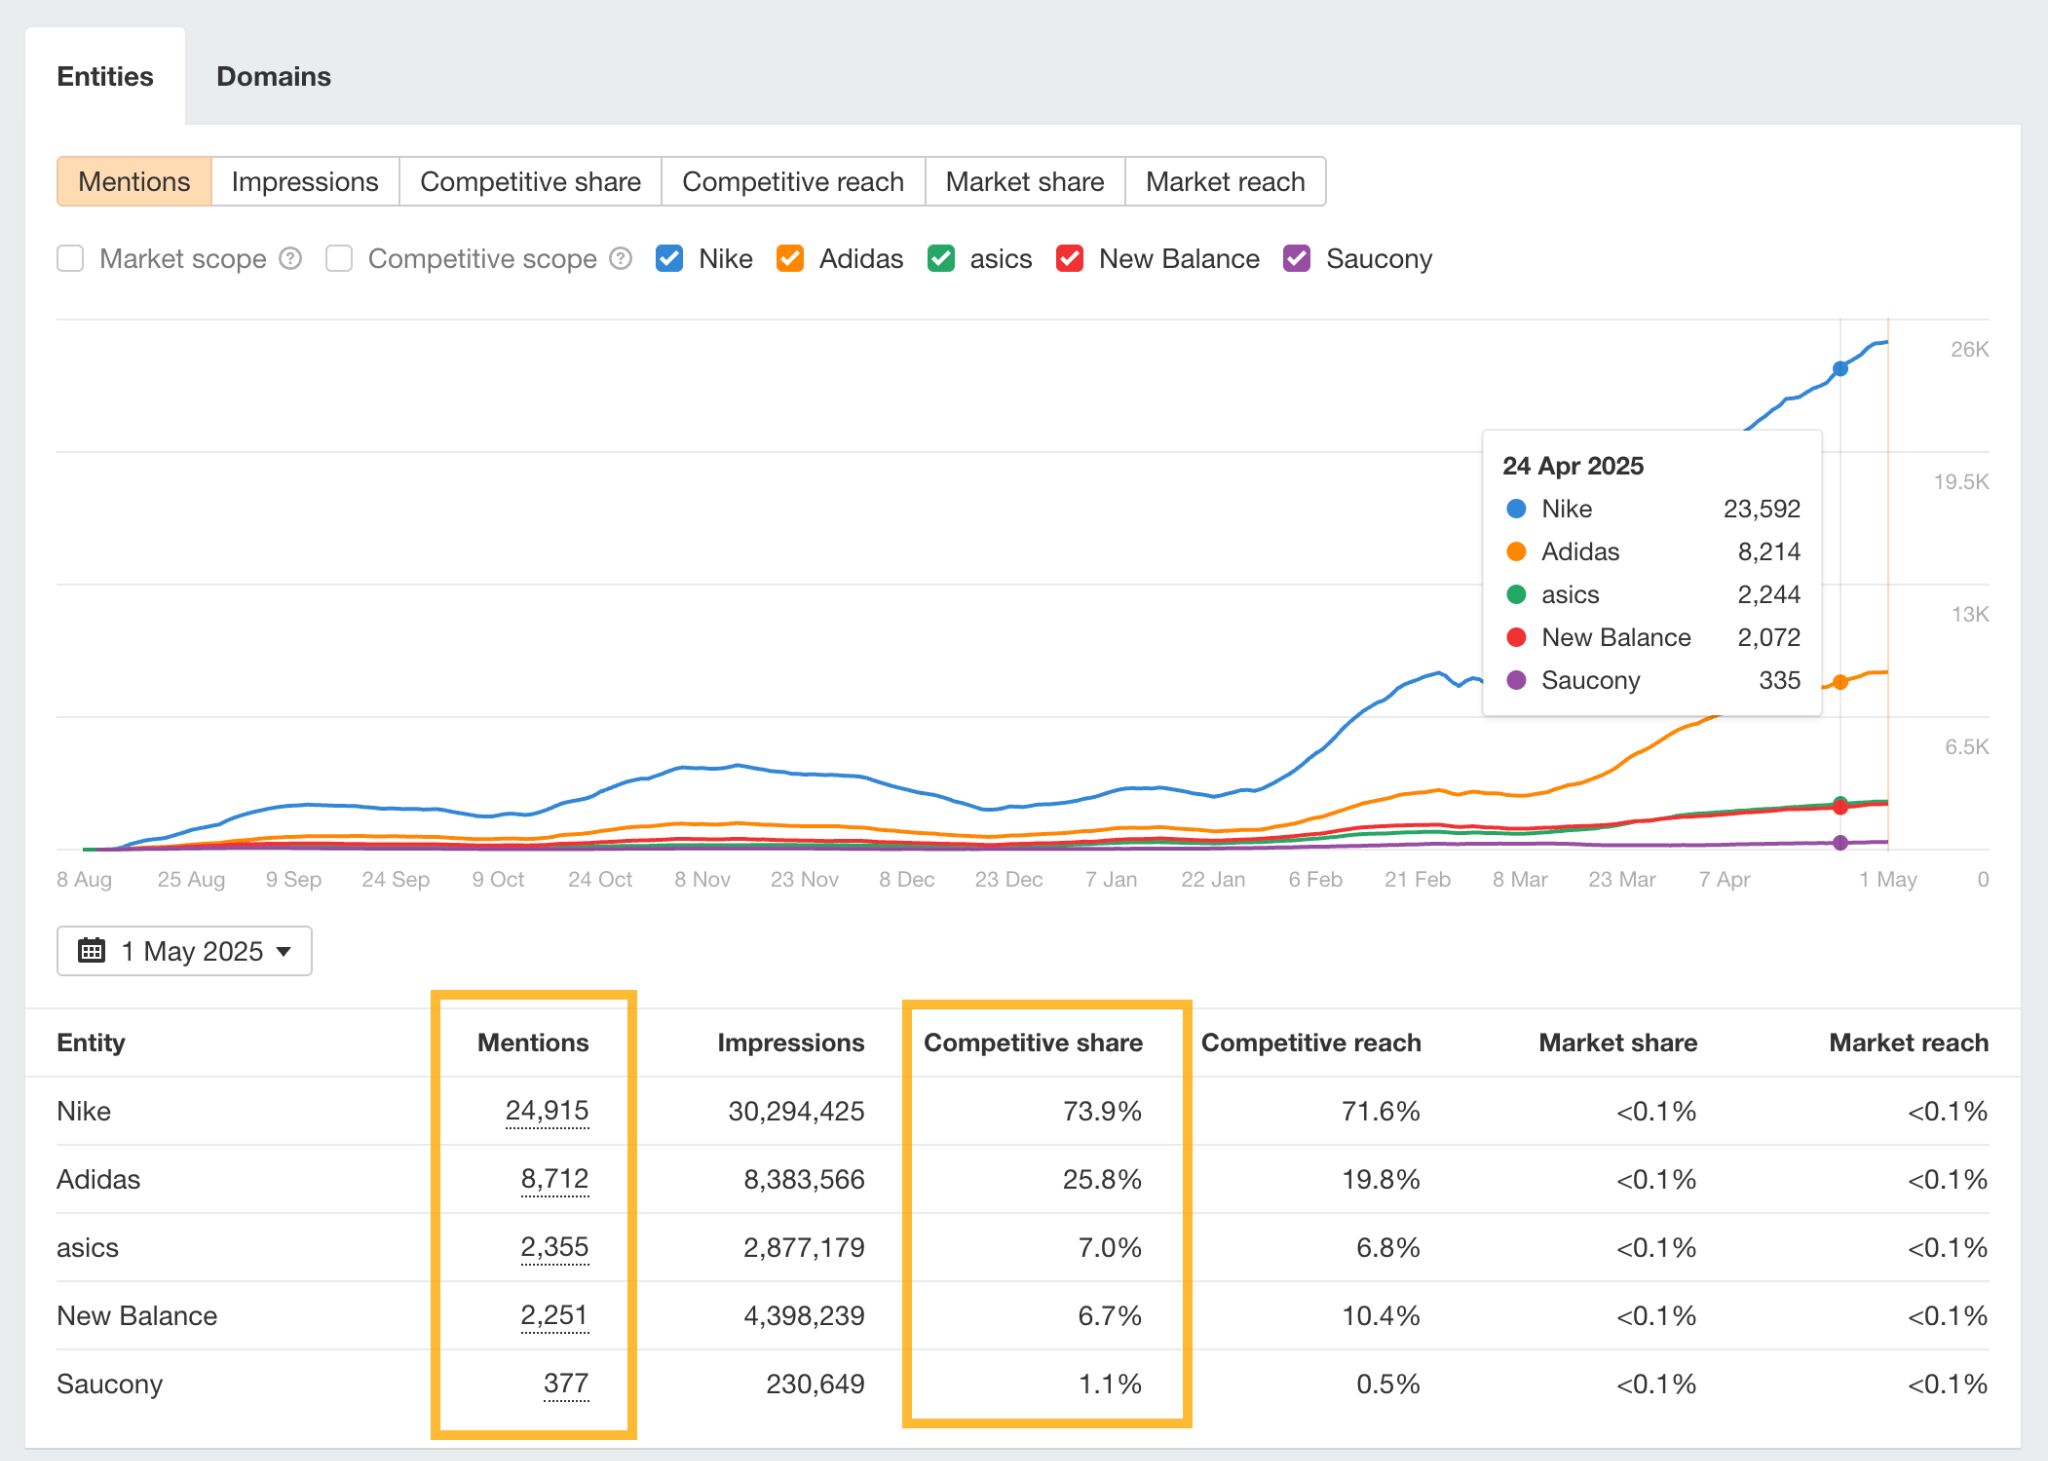
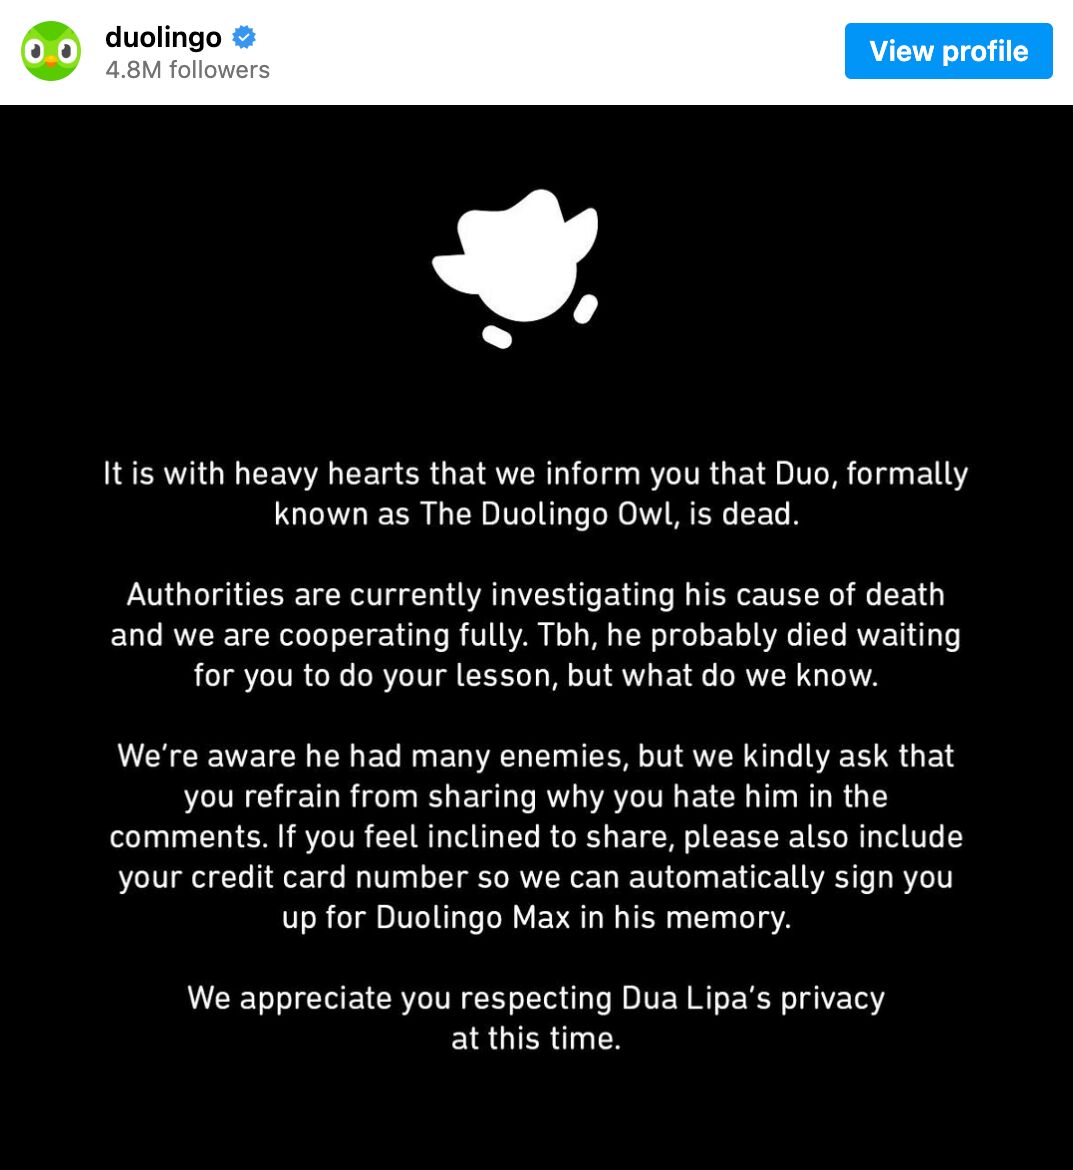
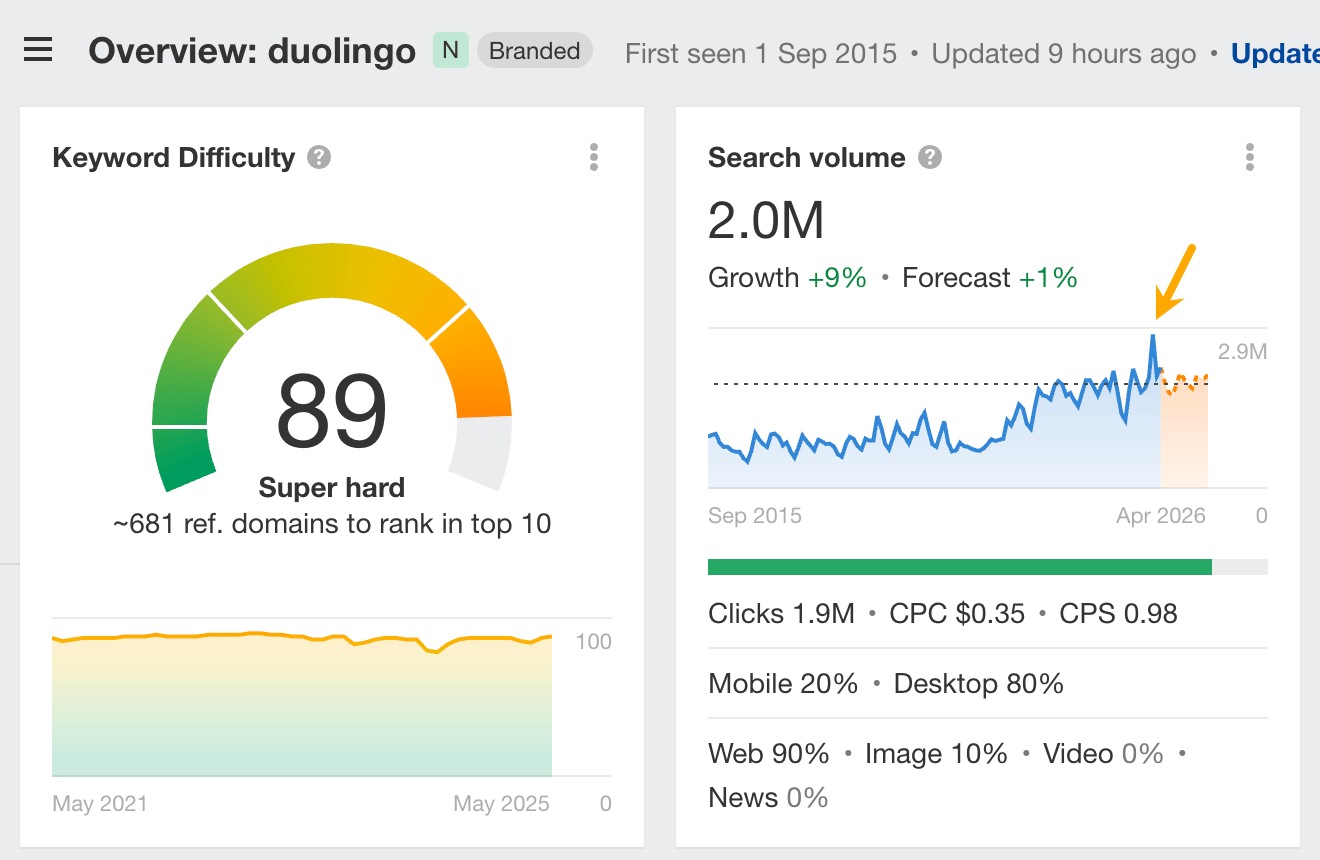
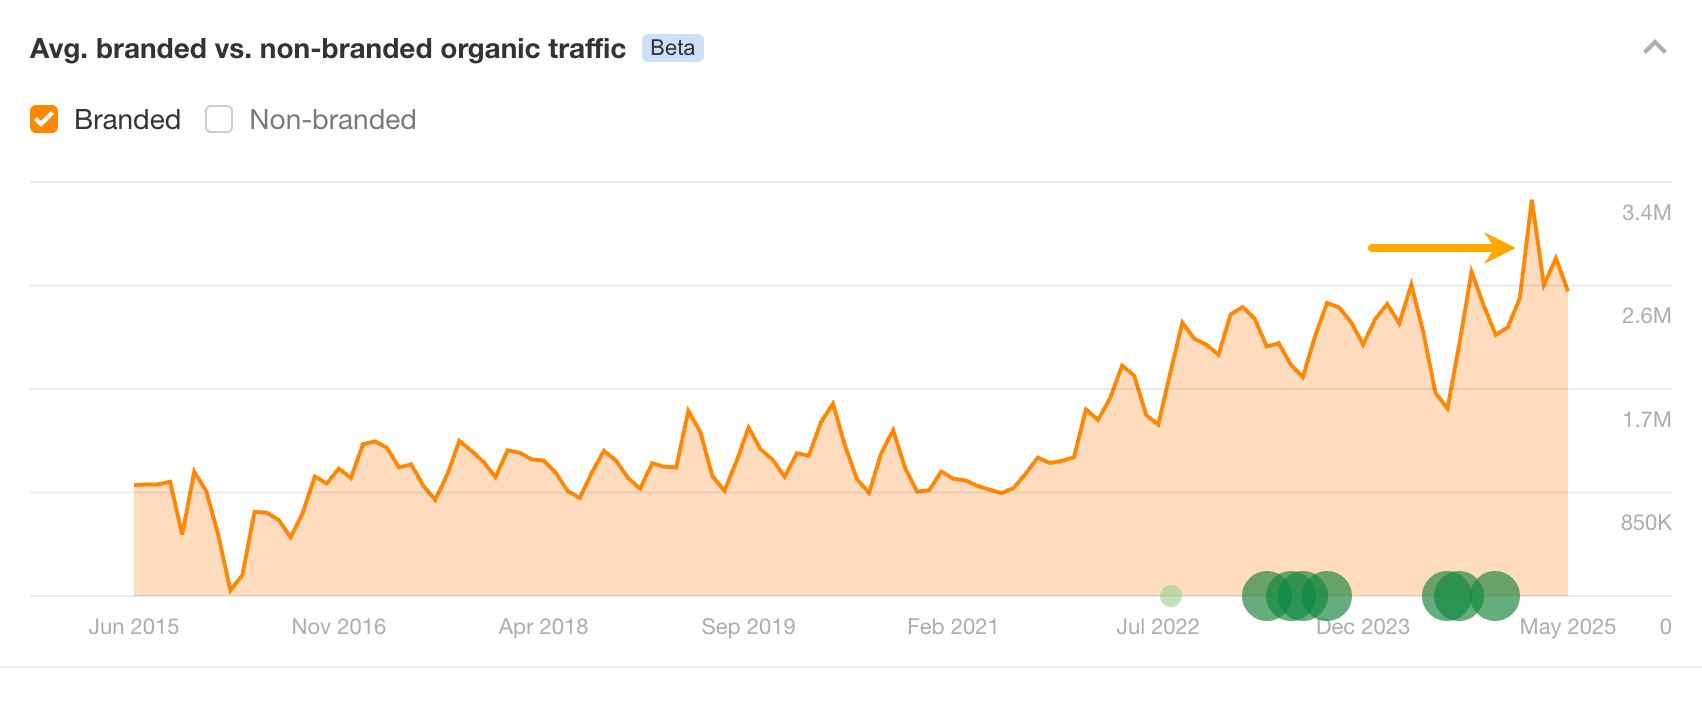
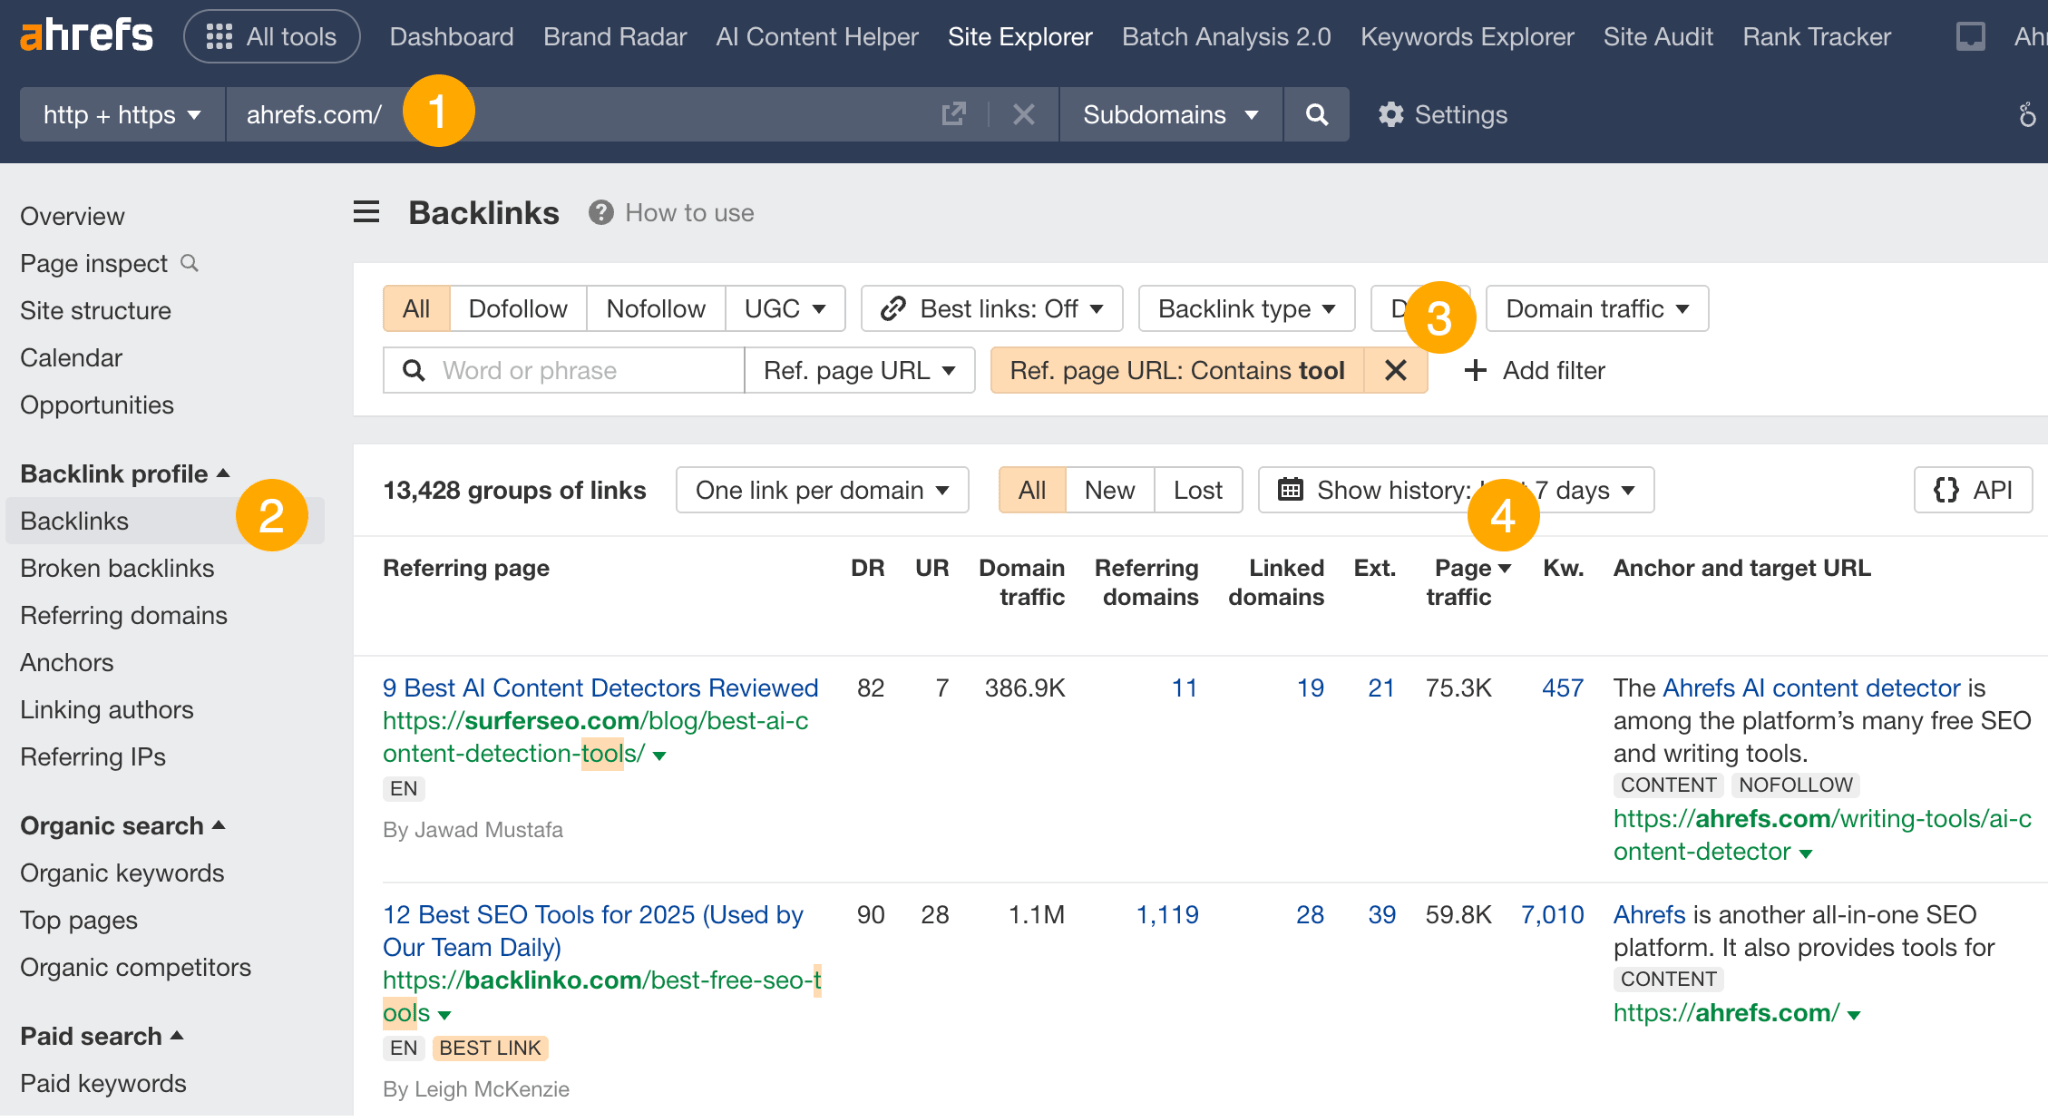
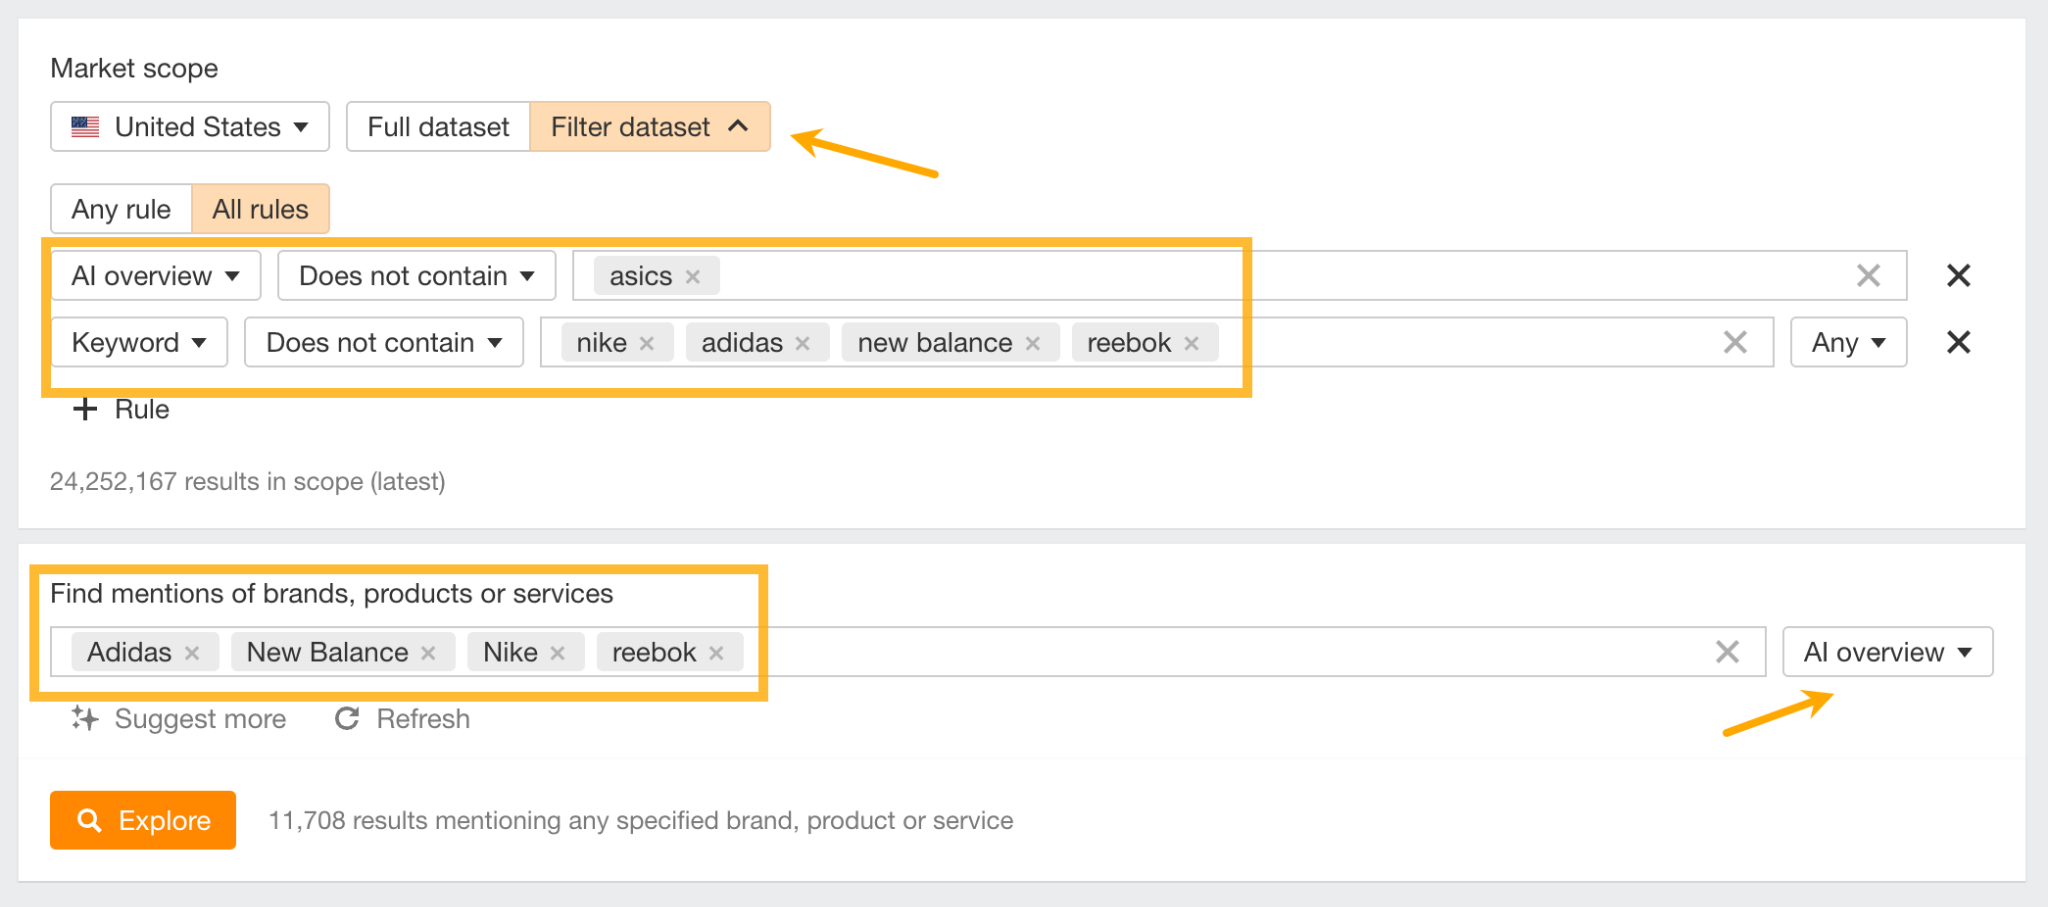
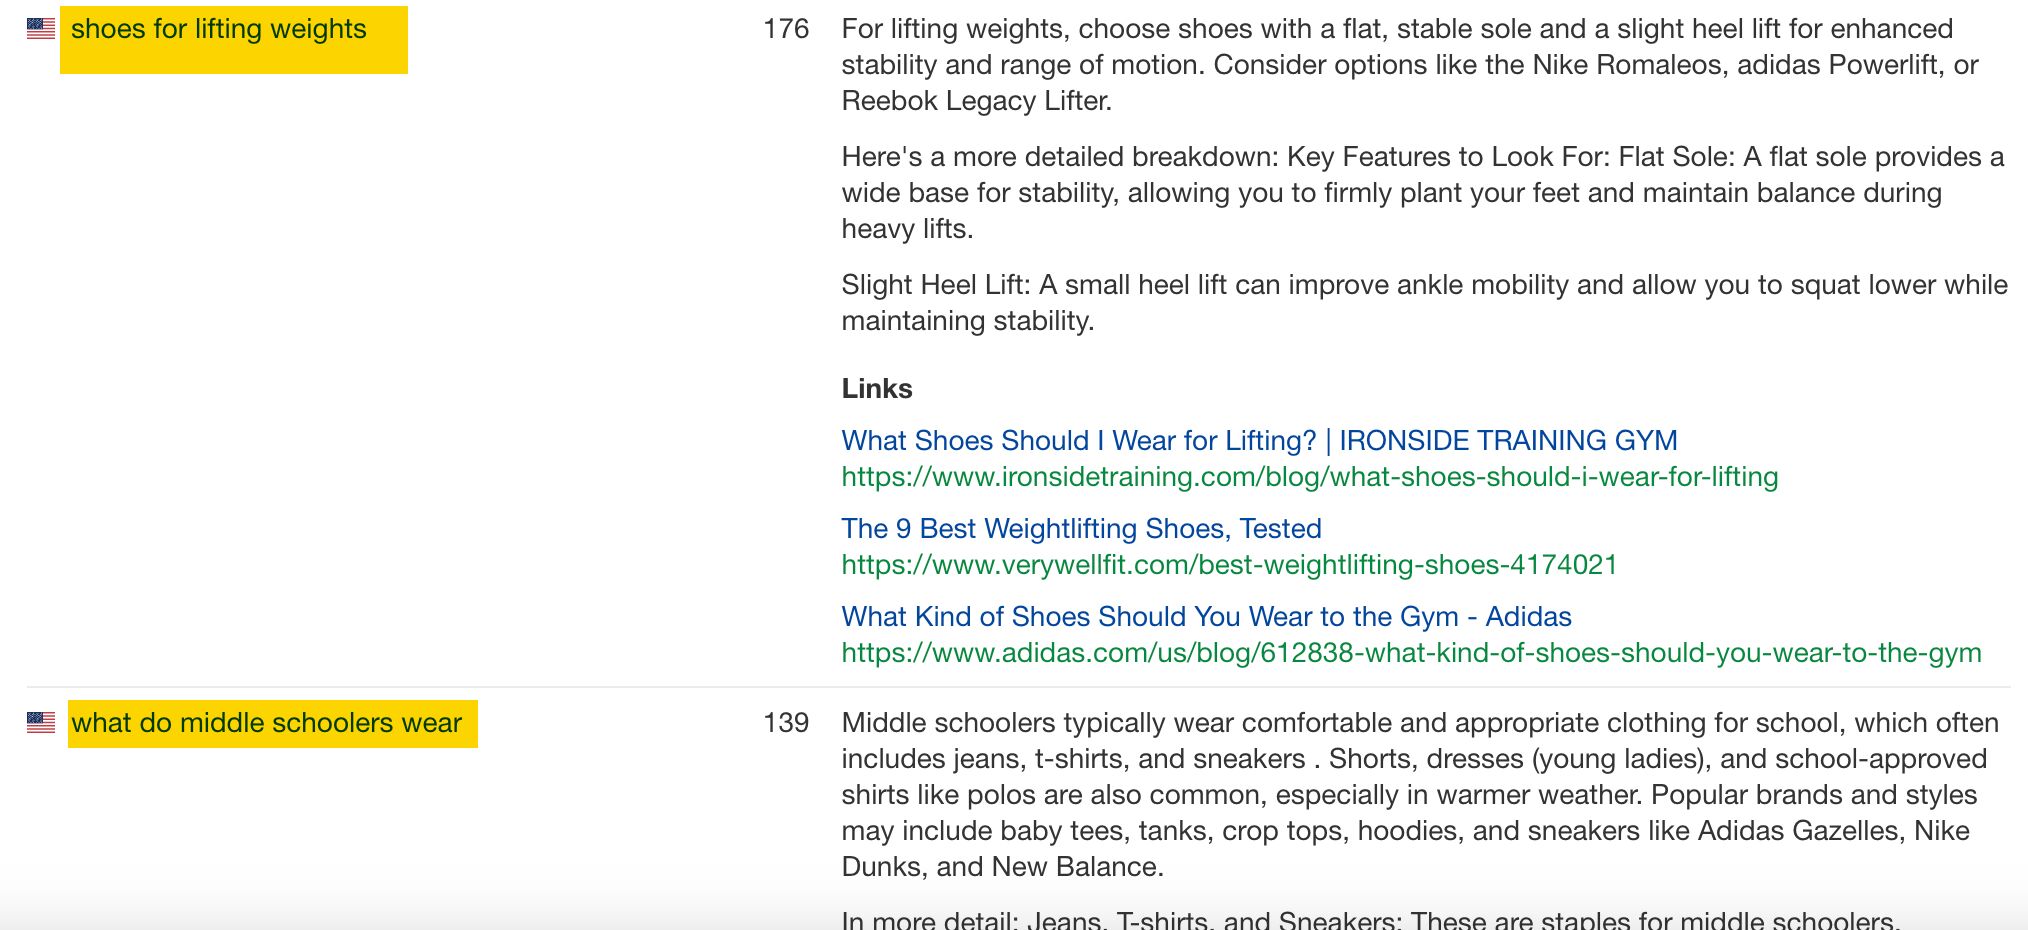
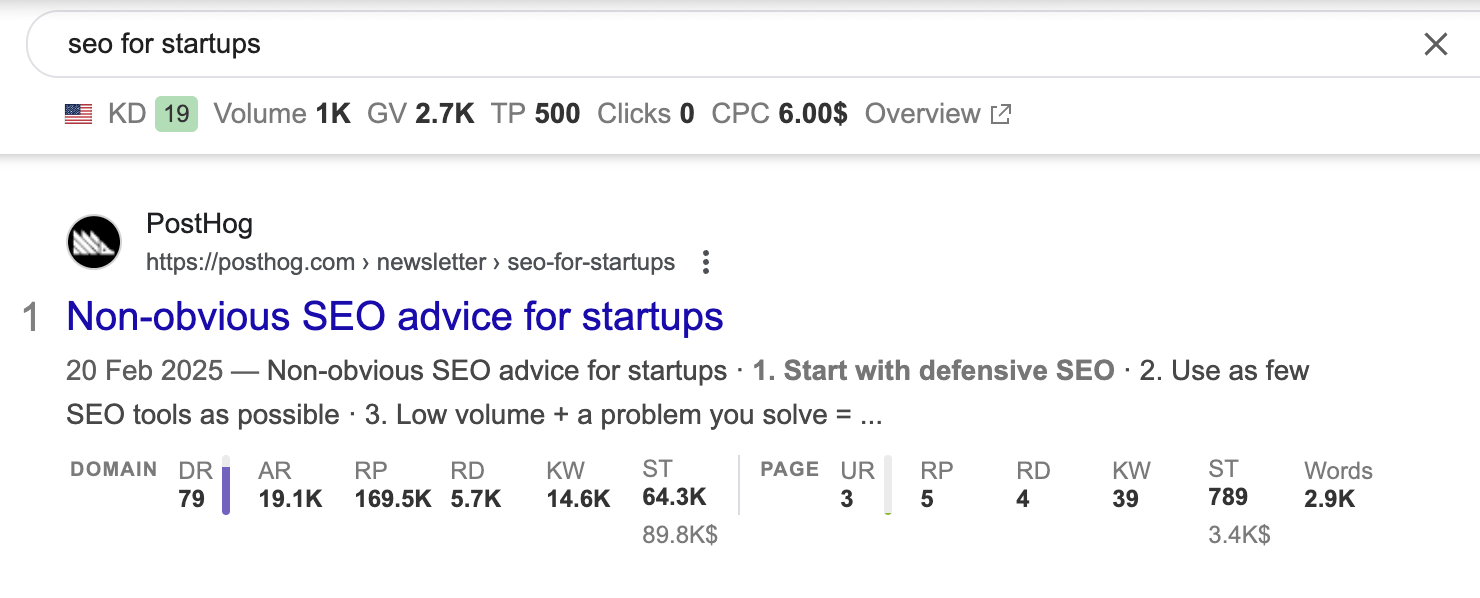
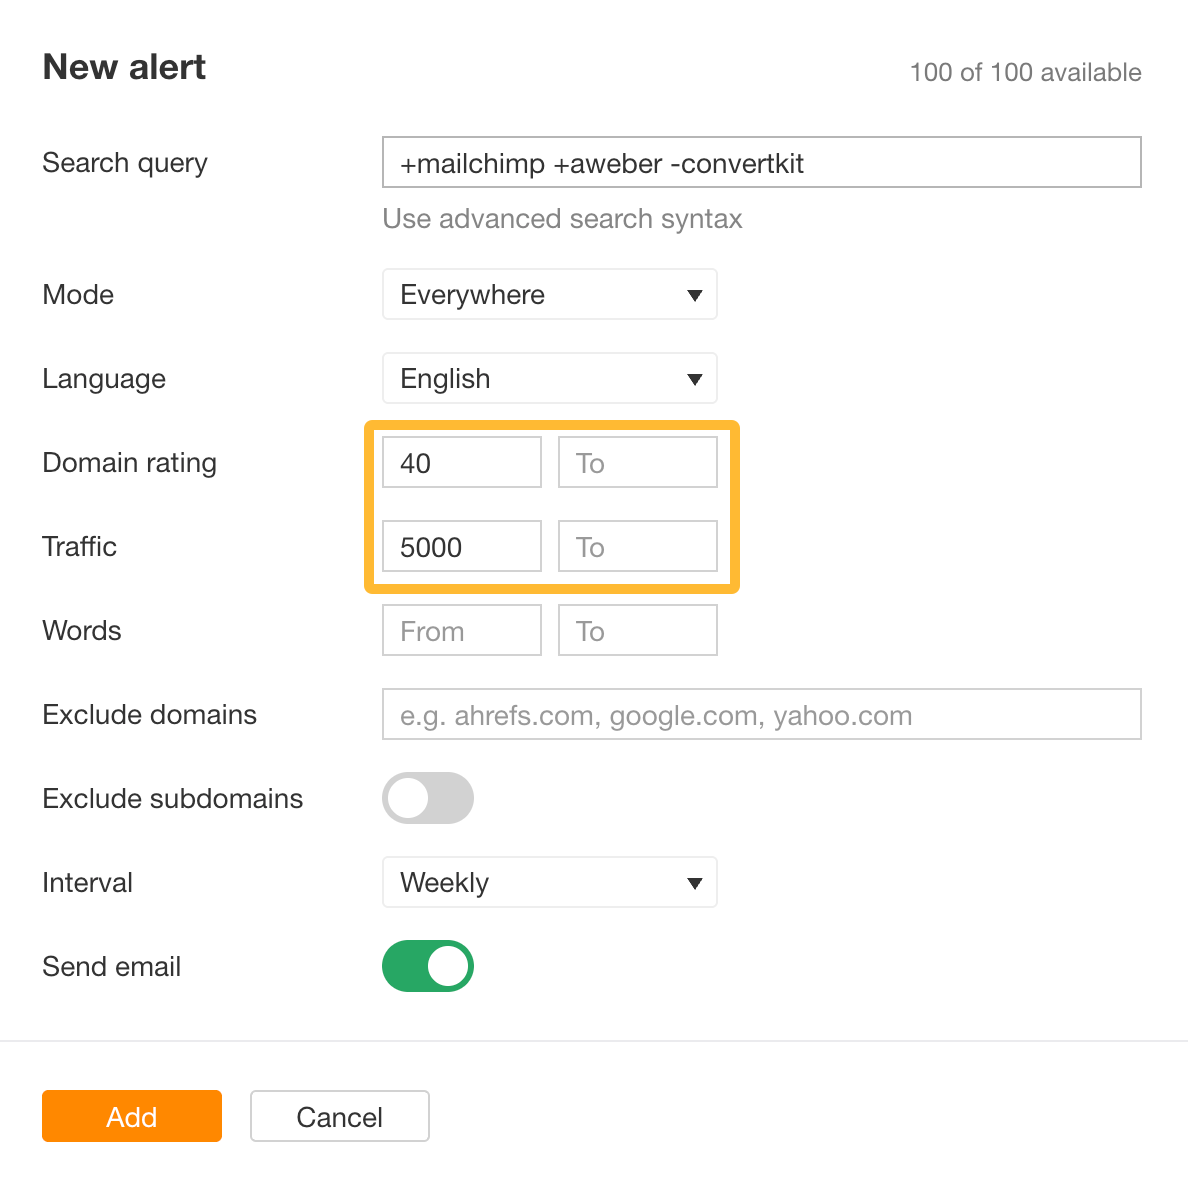
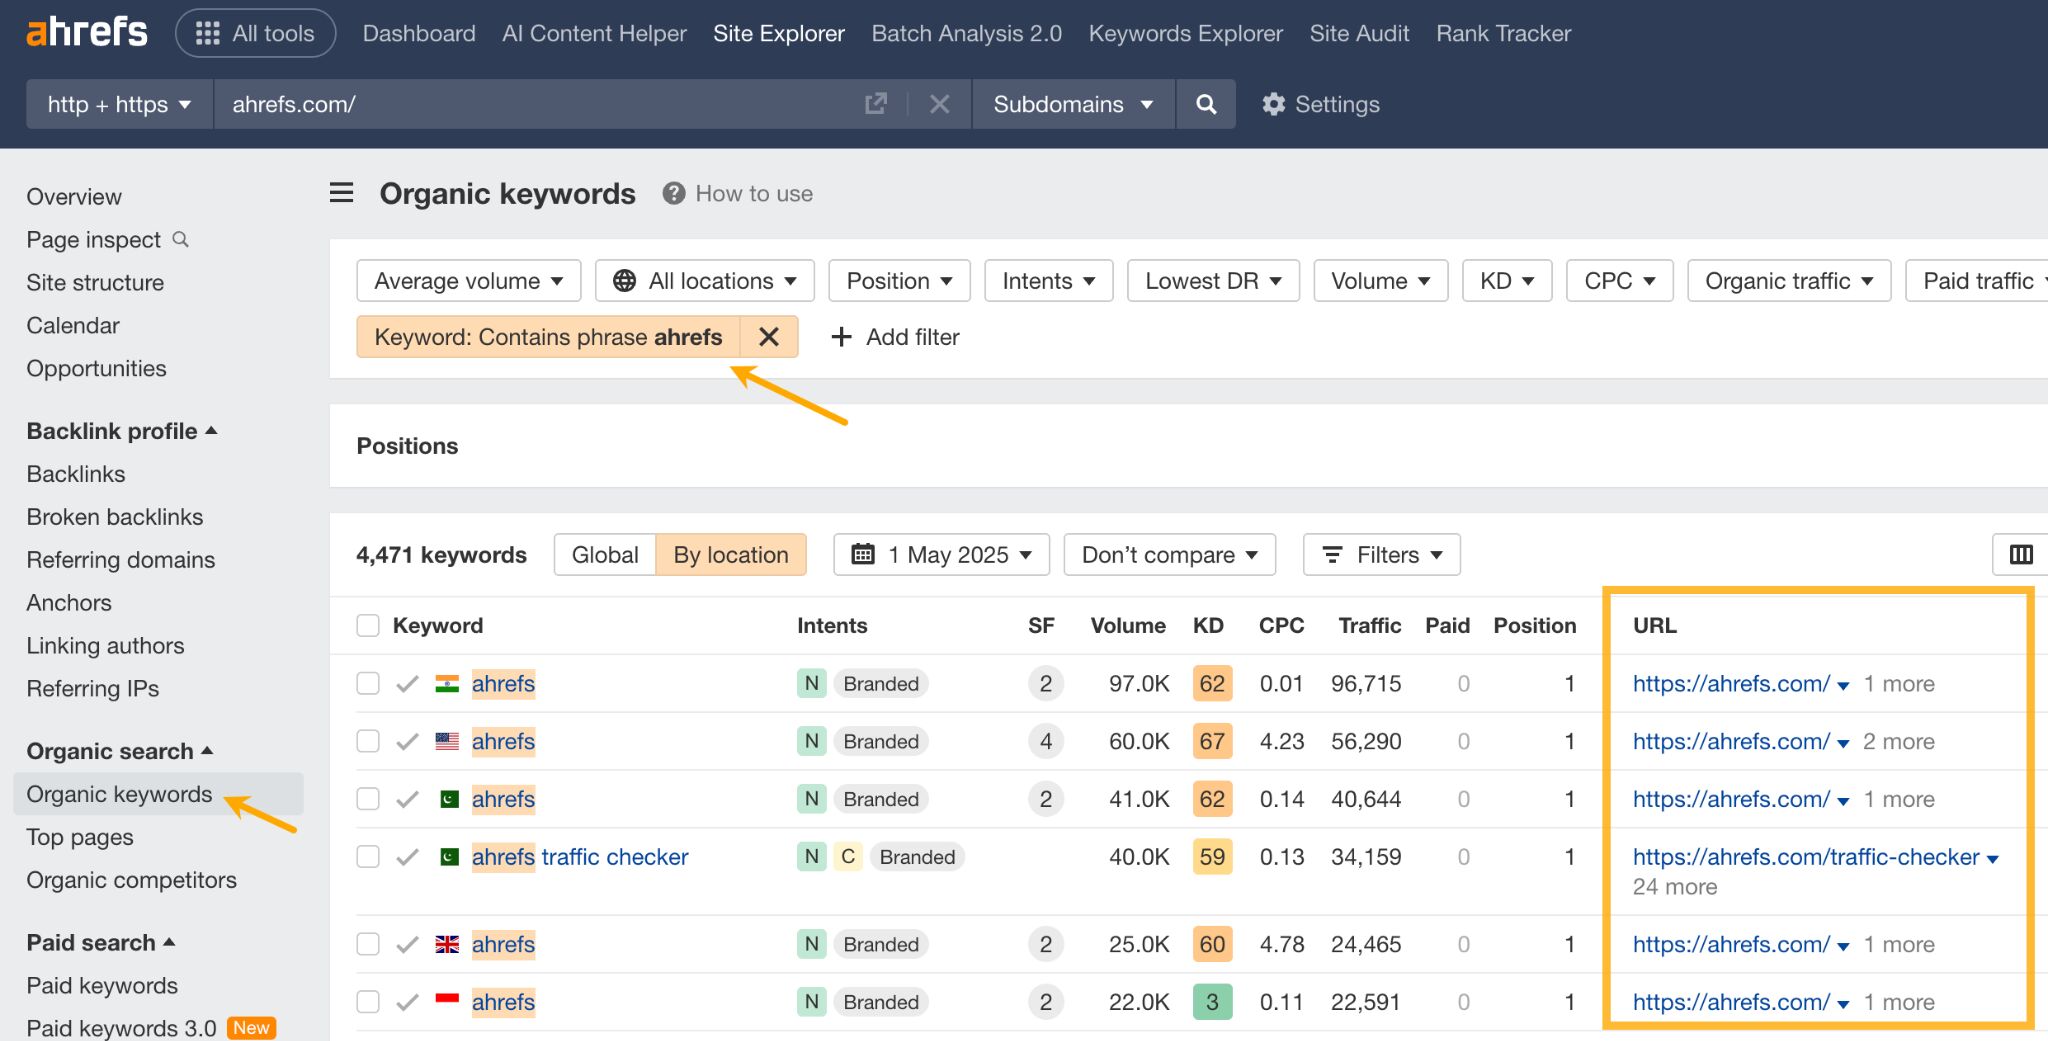
Share of search (SoS) is the percentage of all brand-name searches in your market that mention your brand. To find it, count how many times people searched for your brand name, add up the searches for every competing brand, then divide your number by that total and multiply by 100. For example, let’s say your brand gets 20,000 searches in a month, and your three main competitors get 15,000, 10,000, and 5,000 searches, respectively. The total branded search volume in your category is 50,000. To calculate your share of search: 20,000 ÷ 50,000 × 100 = 40% Because SoS reflects real search behavior, it gives you quick feedback on brand awareness—much faster than surveys or sales reports. If your share of search rises, interest in your brand is probably growing and may soon turn into a higher market share. If it falls, competitors are gaining ground, so you may need to adjust your message or content before sales slip. Checking this metric every month or quarter will help you spot trends early. These are similar metrics that can easily be confused, especially because they all measure competitive visibility, but in very different contexts. Here’s a more detailed comparison to clarify the differences: Tip Ahrefs’ Rank Tracker automatically calculates organic share of voice for all of your target keywords. It also calculates Share of Traffic Value (SoTV)—the share of your target’s organic search traffic value compared to the total organic search traffic value for all tracked keywords. What’s more, you can track the progress of increasing your organic share of search using the historical data. First, you need to get the data on branded search volume. For this, you can use a tool like Ahrefs’ Keywords Explorer. Repeat the same steps for your competitors and key locations. Finally, add all volumes together, divide your brand’s volume, and multiply by 100. The quickest way to crunch the numbers and visualize results is by using an LLM like ChatGPT. For brand names that could mean different things (like “Apple” or “Delta”), you can use Ahrefs’ Parent Topic feature to filter out unrelated searches. This helps you focus only on the topics that are clearly about your brand. Once you’ve narrowed it down, you can export the relevant data to calculate your SoS more accurately. The SoS percentage alone only tells you how much interest you get. To truly judge brand strength in search, you can pair it with other related metrics. This metric tells you how your brand-name searches stack up against total searches for the whole product category. If most people already searching for you still make up only a small slice of all category queries, your brand is well-known to existing fans but still hidden from the wider market. By watching both branded and generic searches together over time, you can see whether you are reaching new audiences beyond your current base and how you stack up against competitors. You can calculate it like this: Category penetration (%) = (Branded search volume ÷ Total category search volume) × 100 For example, let’s say you’re in the project management space. If: Then: Category penetration = (90,000 ÷ 1,500,000) × 100 = 6% This tells you that 6% of all interest in your category goes to your brand. If you’re seeing high branded search volume but your category penetration is low, it means you’re well-known among existing users, but have limited reach beyond your base. In Ahrefs, go to Site Explorer > Overview, add competitors, and check the Average branded vs. non-branded organic traffic section. From there, add up branded searches across competitors to get the category total. Momentum looks at how your brand’s search volume rises or falls each month and stacks that trend against your competitors. Faster growth means you’re gaining attention; slower growth means others are pulling ahead. By lining these shifts up with the dates your campaigns began, you can see which promotions truly lifted your visibility. For instance, in the chart below, you can see how quickly Monday.com began to gain momentum in branded search in 2022. They’re on a good trajectory to catch up with Asana. To quantify momentum: Momentum = % change in branded search volume over a period Suppose: Even though you have more total volume, they have more momentum. This helps you identify rising challengers early. Even if your overall branded search volume is small, ranking well for high-intent queries can still drive sales. Adding this layer to your share-of-search tracking turns it into a practical tool, letting you spot brand gains, rising competitors, or slipping demand sooner. To measure this, use: High-intent traffic ratio = Traffic from commercial/transactional queries ÷ Total traffic Let’s say Ahrefs shows: Then: High-intent traffic ratio = 40,000 ÷ 200,000 = 20% A high ratio here means you’re not just attracting awareness—you’re attracting potential buyers. In Ahrefs, use Site Explorer >Overview > Organic keywords by intent to see traffic breakdown by intent. You can also compare this across brands to see who’s capturing demand. You can also use Ahrefs to compare keyword intent between your brand and competitors. In the same Overview report, you can visualize this on a chart, showing how much of each brand’s keyword footprint targets informational, navigational, commercial, or transactional intent. As Google moves toward AI-powered search results, the way people search for brands could start to change. With AI giving instant summaries on the search page, users might get answers faster, without fully typing a branded query or clicking through to a website. If you want to see how often Google recommends your brand vs your competitors, try out Ahrefs’ Brand Radar. Simply enter your and your competitors’ brand names, and set the mode to AI overviews. This will show you how many times your brand has been mentioned compared to competitors and calculate your share over all mentions. Here are four ideas for using SoS data in your marketing strategy. Share of search helps confirm whether your brand strategy is resonating. If you enter a new market and see an uptick in branded searches before sales appear, it’s a sign that people are paying attention and your positioning is working. It acts as an early pulse check on market fit. Search interest builds across multiple touchpoints. Brands that combine wide-reach campaigns (like TV or social) with useful content often see compounding growth in branded search volume. By tracking this over several weeks or months, you can see how fast your audience responds and adjust your messaging cadence accordingly. Comparing your share of search trend with competitors over time shows who’s gaining or losing visibility, especially around seasonal events or product launches. This helps you respond to market changes before they affect click share, traffic, or engagement. Share of search can be very useful for measuring the impact of brand-building campaigns. You can track changes in branded search volume for your own domain to see how awareness shifts over time, but the real insight comes from comparing that trend against your competitors. This helps you understand whether the lift you’re seeing is truly market-moving or just part of a broader category trend. If your SoS rises while others remain flat or decline, it’s a strong signal that your campaign had a meaningful impact on brand visibility. If you want more people Googling your brand, you need to show up in the right places before they even think to search. That means getting mentioned in trusted articles, reviews, and online communities where potential customers are already hanging out. Let’s look at a few examples. Run campaigns that stick in people’s minds. Whether it’s a cool product drop, a collaboration with an influencer, or a story in the media, give them a reason to look you up later. For example, when Duolingo announced the death of the Duolingo mascot during a viral campaign in February 2025, the search volume for the term “duolingo” peaked to a new all-time high, and so did the branded traffic to the site (see charts below). Look at where your competitors are mentioned online and aim to get your brand featured in those same places. This is a proven way to build awareness in the right context, so when people are ready to search, your brand is already on their radar. One way to do this is by following backlinks to your competitors. Here’s how it works in Ahrefs’ Site Explorer. Open referring pages and see if you can get a good angle to pitch your product. Another effective way to find high-profile brand mentions is to use Ahrefs’ Brand Radar. Now, look at the keywords where Google recommends your competitors but not your brand. These are the topics where you’re being left out of the conversation. Try to get your products or brand mentioned on those same pages. This could mean pitching your product to the author, offering expert input, or creating content that’s even more helpful. Of course, you don’t have to wait for others to mention your brand. You can take the lead by targeting non-branded keywords that relate to your audience’s problems. Then, position your brand as the solution directly within that content. To do this effectively, you’ll need solid keyword research to find the right terms and topics. We’ve got a full guide on how to do that, so you can start creating content that not only ranks but also earns attention for your brand. For example, I wouldn’t naturally link a marketing analytics brand like PostHog with the term “SEO for startups.” But thanks to a sharp, well-written article on the topic, they now rank in the top 10 for that keyword. By doing this, they’ve expanded their reach, boosted brand awareness, and introduced their product in a highly relevant context. And if you want to stay on top of what’s happening, tools like Ahrefs Alerts are perfect for keeping your finger on the pulse. You can set them up to monitor the web for pages that mention your competitors but not your brand. This helps you spot potential link or mention opportunities you might be missing out on. You can also add filters, like Domain Rating or estimated traffic, to focus only on high-quality sites (these could give you a bigger SEO boost). Last but not least, when someone does look you up, make sure your site is ready: clear pages for things like returns, pricing, or support, and easy navigation that helps them find what they’re looking for fast. A list of your branded keywords will help you with that. Simply go to Ahrefs’ Site Explorer, open the Organic keywords report, and plug in your brand name. Then see if the likely reason behind the keyword matches the page that ranks for it. While the share of search is a powerful way to gauge brand interest and spot early shifts in market visibility, it’s important to understand its limitations. Finally, remember that third-party tools have limits in accuracy and coverage, so always cross-check where possible. No metric is flawless and share of search has its quirks. But it’s one of the few ways to peek inside the minds of potential customers at scale. Track it, cross-check it, and combine it with what you already know. Over time, it’ll help you understand not just how your brand is performing, but why. Got questions or comments? Find me on LinkedIn.AspectClassical Share of VoiceOrganic Share of VoiceShare of Search Core question How loud is our paid media compared with competitors? How visible is our website in organic SERPs on a keyword set? How salient is our brand in consumers’ search behaviour? What’s measured % of total advertising impressions, spend, or GRPs your brand captures % of total organic clicks/traffic your site receives across tracked keywords % of all branded‑search queries in the category that mention your brand Primary data source Media-buying logs, Nielsen/Comscore, ad‑server reports Ranking & CTR models (e.g., Ahrefs’ Rank Tracker) Google Trends or keyword research tools like Ahrefs’ Keywords Explorer Calculation Brand ad impressions ÷ total market impressions (or spend) Site Explorer: your est. traffic ÷ sum of traffic of you + competitors; Rank Tracker: your clicks ÷ total clicks across SERP results for tracked keywords Brand’s search volume ÷ total branded‑search volume for competitor set Update cadence Weekly – monthly (ad data lag) Daily – weekly (depends on rank‑check schedule) Monthly – quarterly (smooths brand‑search noise) Key strengths Budget benchmarking & media‑mix planning; covers all paid channels Granular, keyword‑level diagnostics; captures SEO/content wins & losses quickly Leading indicator of market‑share shifts; tied to real demand, not spend Main limitations Exposure ≠ attention; often lagging/sample‑based data Only organic Google results; needs well‑chosen keyword basket Works best for distinctive brand names; doesn’t explain why demand changed Typical owners Brand & media planners SEO and content teams CMOs, brand & insights teams 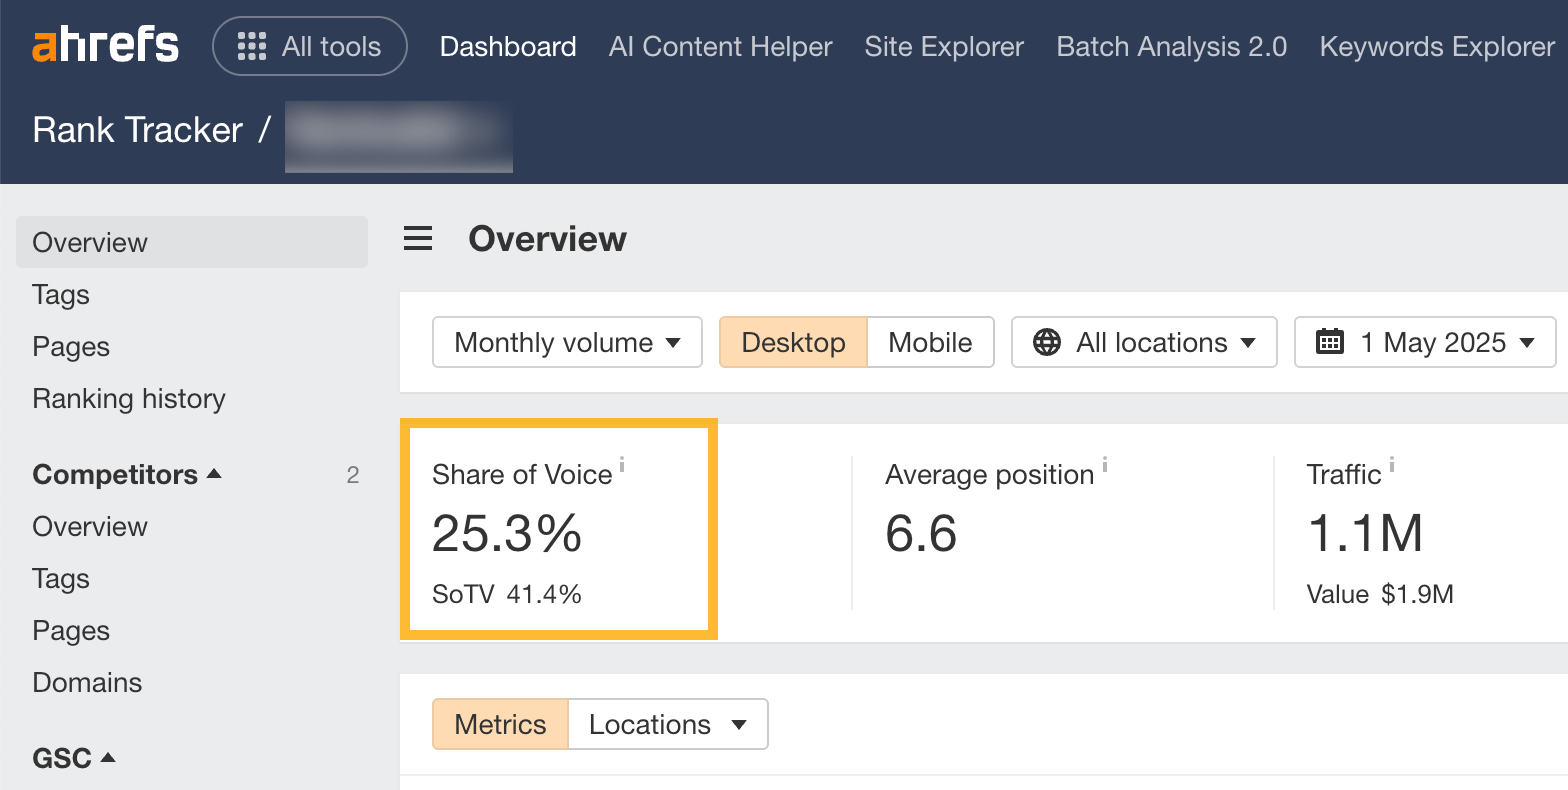

Category penetration
Momentum
Conversion-oriented intent
Share of Search in Google’s AI Answers
Validate strategic direction early
Monitor campaign momentum
Spot competitive shifts early
Track long-term brand impact
Run campaigns that spark branded searches
Find competitor mentions using backlinks
Find competitor mentions using brand mentions in AI overviews
Create content for non-branded searches
Monitor missed brand mention opportunities
Optimize your branded search experience
Final thoughts