XRP Price Prediction – Can 100 SMA Trigger Another Steady Increase
XRP price is correcting gains from the $0.570 resistance. The price is stable above the $0.5240 support and might aim for a fresh increase in the near term. XRP started a decent increase and climbed above the $0.550 resistance....
 Troov
Troov

XRP price is correcting gains from the $0.570 resistance. The price is stable above the $0.5240 support and might aim for a fresh increase in the near term.
XRP started a decent increase and climbed above the $0.550 resistance. The price is now trading above $0.5250 and the 100 simple moving average (4 hours). There is a key bullish trend line forming with support at $0.5320 on the 4-hour chart of the XRP/USD pair (data source from Kraken). The pair could start another increase if the bulls defend the $0.5240 support.XRP Price Holds Support
Recently, XRP price started a decent increase above the $0.5250 resistance zone. The bulls even pushed the price above the $0.550 resistance zone before the bears appeared.
A high was formed at $0.5699 before there was a pullback like Bitcoin and Ethereum. The price dipped below the $0.550 support zone. The price declined below the 23.6% Fib retracement level of the upward move from the $0.4787 swing low to the $0.5699 high.
However, the price is now stable above $0.5250 and the 100 simple moving average (4 hours). There is also a key bullish trend line forming with support at $0.5320 on the 4-hour chart of the XRP/USD pair.
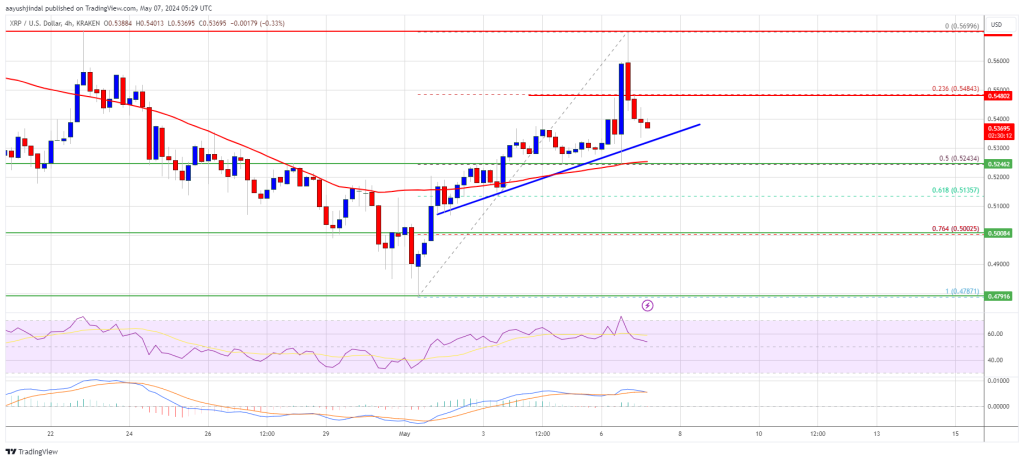
Source: XRPUSD on TradingView.com
Immediate resistance is near the $0.5480 level. The first key resistance is near $0.570. A close above the $0.570 resistance zone could spark a strong increase. The next key resistance is near $0.5850. If the bulls remain in action above the $0.5850 resistance level, there could be a rally toward the $0.620 resistance. Any more gains might send the price toward the $0.680 resistance.
More Losses?
If XRP fails to clear the $0.5480 resistance zone, it could start another decline. Initial support on the downside is near the $0.5320 level and the trend line.
The next major support is at $0.5240 and the 100 simple moving average (4 hours). If there is a downside break and a close below the $0.5240 level, the price might accelerate lower. In the stated case, the price could retest the $0.50 support zone.
Technical Indicators
4-Hours MACD – The MACD for XRP/USD is now losing pace in the bullish zone.
4-Hours RSI (Relative Strength Index) – The RSI for XRP/USD is now above the 50 level.
Major Support Levels – $0.5320, $0.5240, and $0.500.
Major Resistance Levels – $0.5480, $0.570, and $0.600.
Disclaimer: The article is provided for educational purposes only. It does not represent the opinions of NewsBTC on whether to buy, sell or hold any investments and naturally investing carries risks. You are advised to conduct your own research before making any investment decisions. Use information provided on this website entirely at your own risk.