Google’s Expert Advice On SEO Troubleshooting With DevTools via @sejournal, @MattGSouthern
In a new video, Google Developer Advocate Martin Splitt teaches viewers how to use Google Chrome DevTools to perform basic SEO troubleshooting steps. The post Google’s Expert Advice On SEO Troubleshooting With DevTools appeared first on Search Engine Journal.

Google has once again shared its expertise with the SEO and digital marketing communities by publishing a new installment of its Lightning Talks video series on YouTube.
In the latest video, Google Developer Advocate Martin Splitt teaches viewers how to use Google Chrome DevTools to perform basic SEO troubleshooting steps.
Splitt’s expert knowledge and easy-to-follow instructions make this video an easy recommendation for anyone with developer experience looking to optimize their website’s search engine rankings.
Here are a few ways to use Chrome DevTools to troubleshoot common SEO issues on a staging site before it goes live.
Using The Mobile-Friendly Test
Using the Mobile-Friendly Test in Google Search Console is a great place to start.
When you test the URL of your staging environment, it will show you if there are any missing elements in the rendered HTML.
If that’s the case, don’t worry; you can look closely at what’s happening by opening the website in your browser and using Google Chrome DevTools.
Using The Elements Tab In DevTools
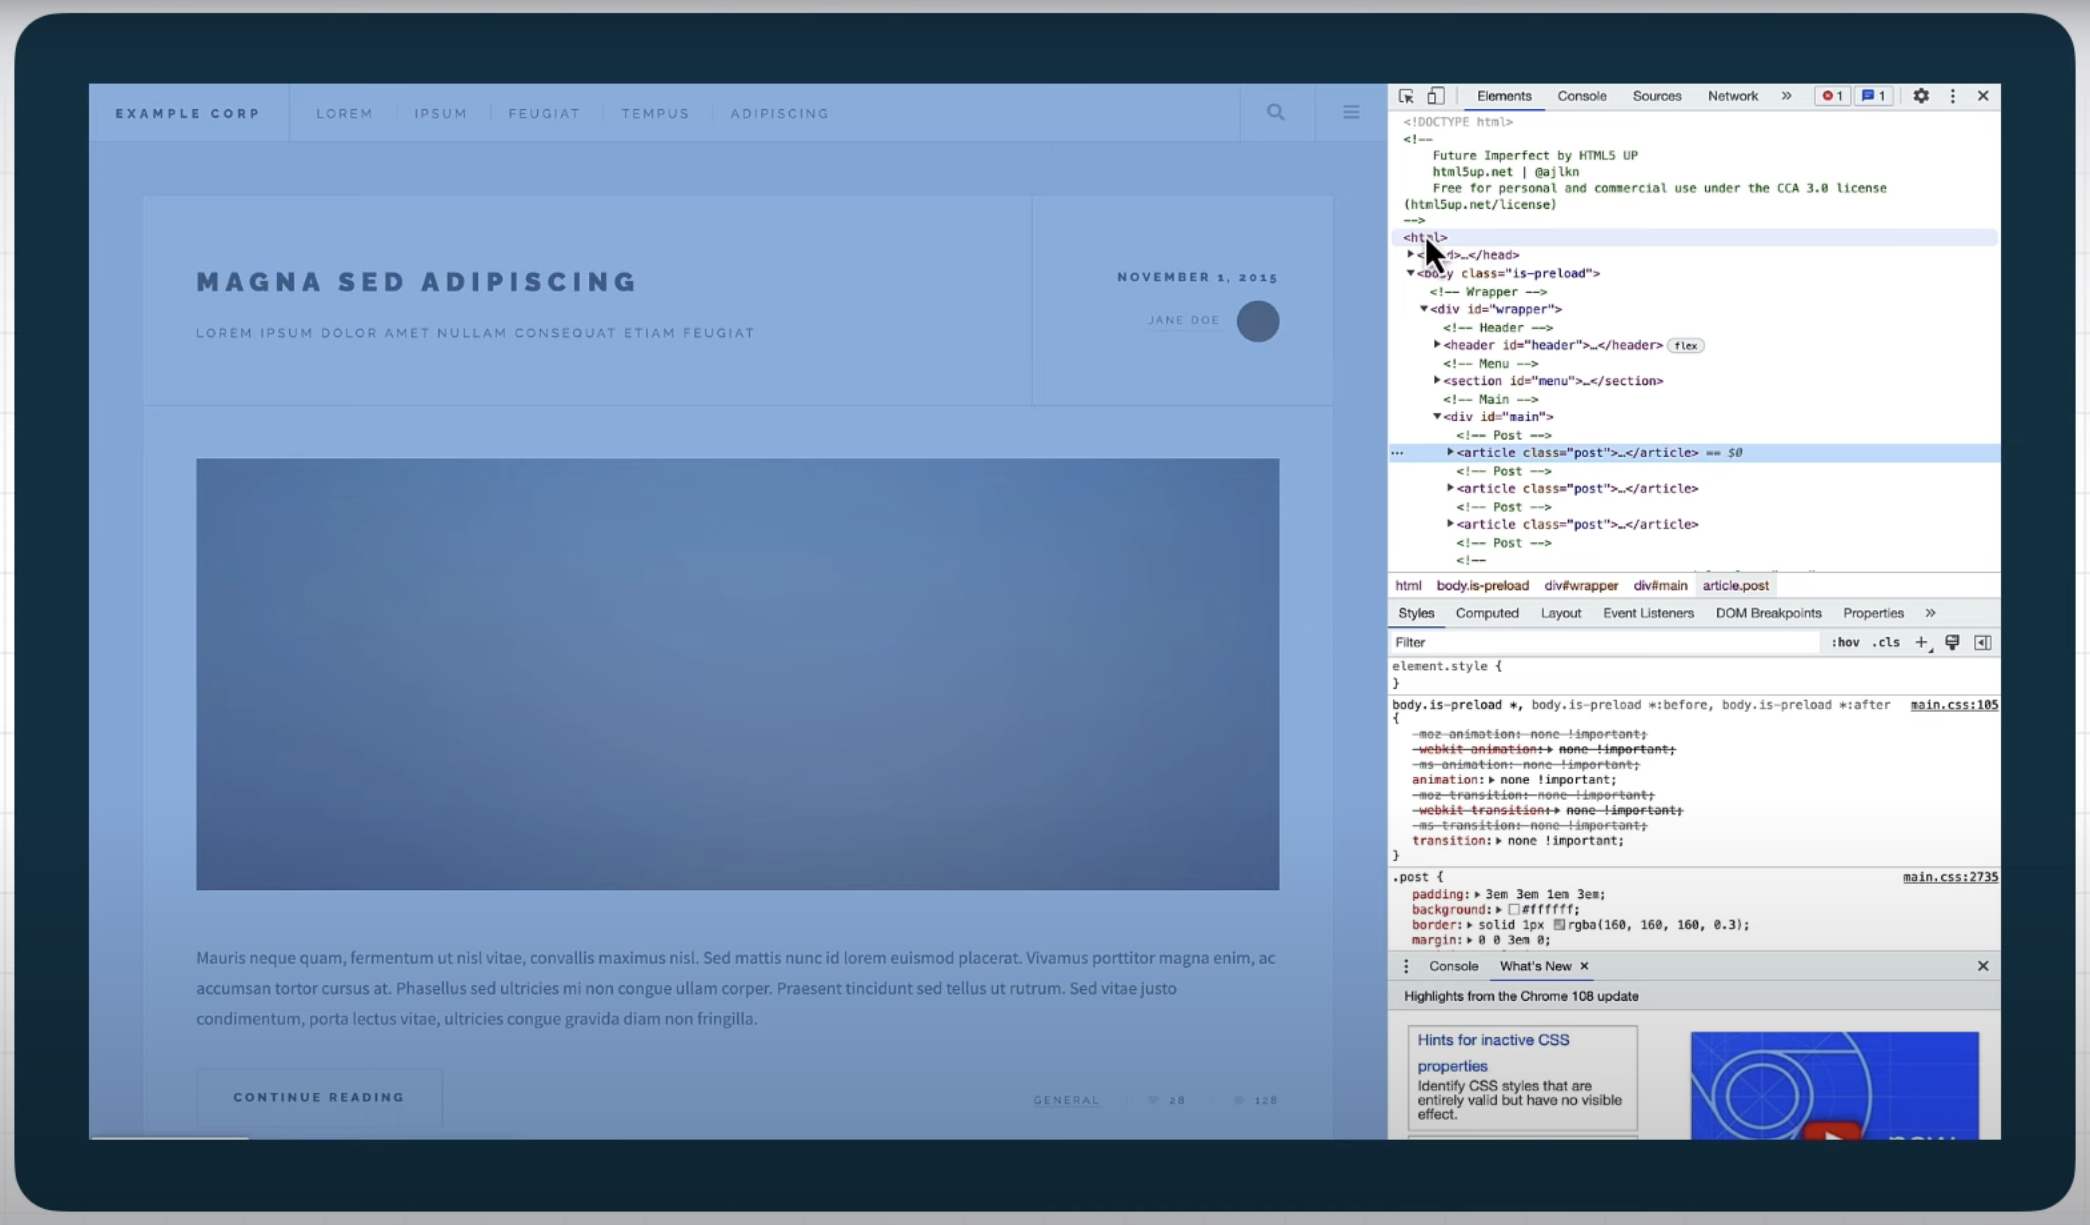
 Screenshot from: YouTube.com/GoogleSearchCentral, February 2023.
The Elements tab in DevTools will give you an HTML representation of the page’s Document Object Model (DOM).
This is a valuable tool for searching for content on the page and determining whether it’s present in the DOM.
If the content is missing in the rendered HTML, it will also be missing in the DOM.
Using The Network Tab
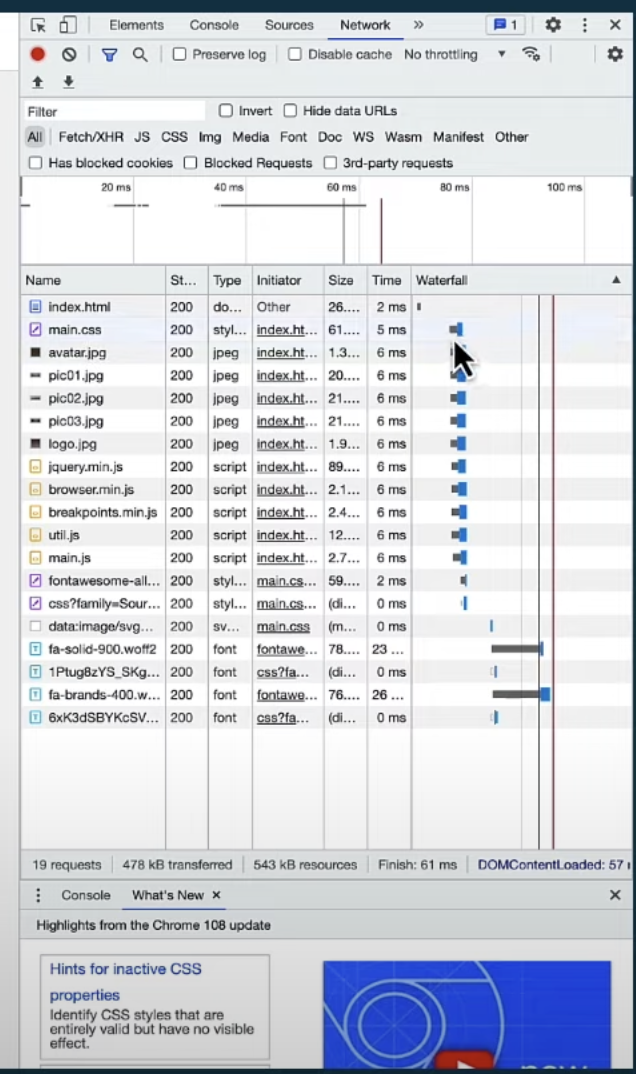
 Screenshot from: YouTube.com/GoogleSearchCentral, February 2023.
The Network tab in DevTools allows you to see what’s happening between the server and your browser.
When you reload the page, you’ll be able to see each request and response from the server.
The waterfall diagram will show how long everything takes and where the time is spent.
You can also inspect all requests and response headers, which can help you look for specific headers, such as the X-Robots header.
This can help determine whether the missing content has made its way from the server to the browser.
If the content only appears after scrolling the page, you can use the Initiator tab to see what requested it.
This information can then be used to fix the issue.
Setting Network Conditions
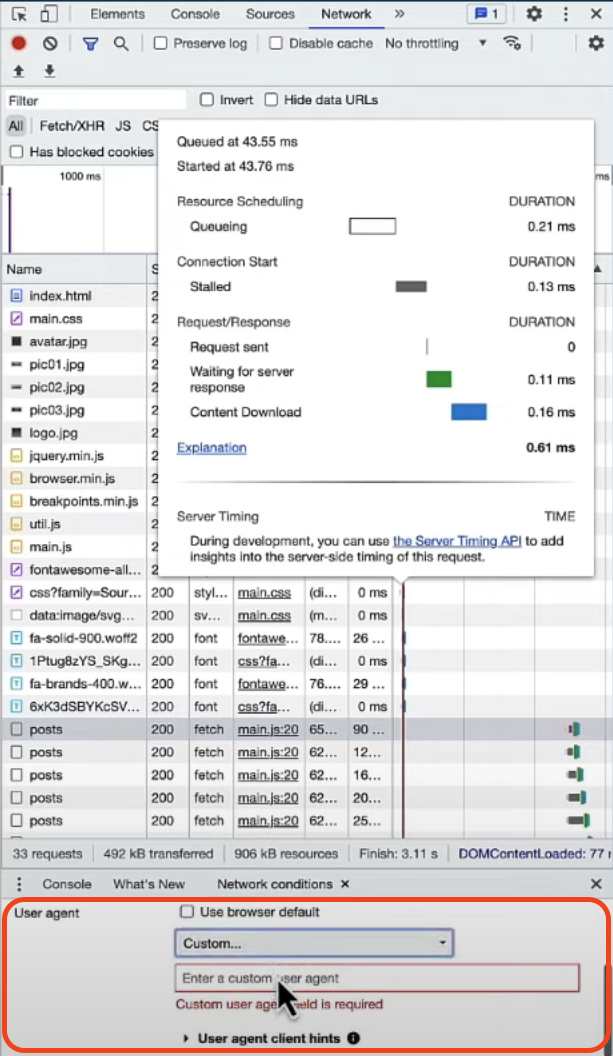
 Screenshot from: YouTube.com/GoogleSearchCentral, February 2023.
The Network tab in DevTools has other features, such as disabling the cache, setting the network transfer speed, and changing the user agent.
However, it’s important to note that setting the user agent to Googlebot may not yield the expected results.
Googlebot also respects the robots.txt file, which your browser ignores, and some sites may do IP lookups to see if the request is coming from a Google data center.
In conclusion, the browser’s Developer Tools offer a powerful suite of debugging tools for SEO troubleshooting.
You can use the Elements Tab to inspect the DOM, the Network Tab to inspect network requests and responses and set network conditions such as caching and user agent.
You can quickly diagnose and resolve various SEO issues by combining these with the testing tools in Google Search Console.
Featured Image: Screenshot from YouTube.com/GoogleSearchCentral, February 2023.
Source: YouTube

 Tekef
Tekef 


