Most Marketing Metrics Are Misleading. Here’s What Leaders Measure Instead
Key Takeaways Your marketing reports probably look fine. Traffic is up. Engagement is solid. Return on ad spend (ROAS) hits the benchmarks your team set last quarter. But here is the problem with why your marketing reports are inaccurate:...
 BigThink
Key Takeaways
Traditional marketing metrics like traffic, search rankings, and ROAS were designed for a more trackable internet. They still have uses, but they no longer tell the full story. Marketing attribution assigns credit to touchpoints but cannot prove that marketing caused the outcome. It typically rewards demand capture over demand creation. ROAS averages compress marginal return curves into a single number, hiding where spend becomes inefficient. Executives want to know whether marketing caused growth, not just whether activity occurred. Those are different questions with different answers. Modern measurement tracks incremental signals, branded demand growth, and customer value metrics to give a more complete picture of what is actually working.Your marketing reports probably look fine. Traffic is up. Engagement is solid. Return on ad spend (ROAS) hits the benchmarks your team set last quarter. But here is the problem with why your marketing reports are inaccurate: the numbers that look best are often the ones least connected to actual business growth.
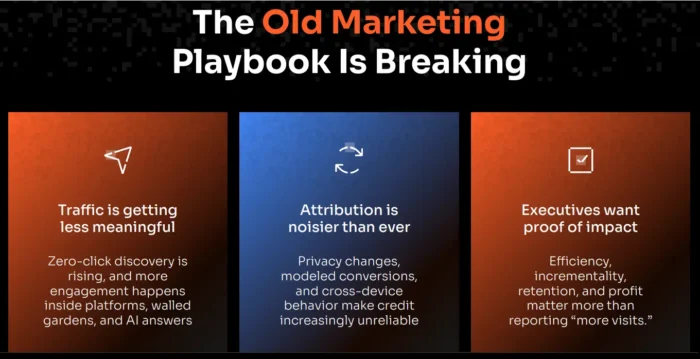
Marketing dashboards were built for a version of the internet that no longer exists. When clicks were cheap and user journeys were predictable, tracking activity was a reasonable proxy for impact. That is no longer the case. Discovery now happens in AI summaries, social feeds, and private conversations that never show up in analytics. Attribution systems reward the last touchpoint, not the one that created demand. And ROAS averages can hide the fact that the last dollar spent barely broke even.
The shift underway is significant. Measurement is moving from tracking activity to proving impact. Marketing leaders who recognize this will make better budget decisions and communicate more credibly with leadership.
This is the first part of a three-part series examining how modern organizations measure marketing performance in a way that actually connects to growth.
The Old Marketing Scoreboard Was Built for a Different Internet
For most of the last decade, marketing teams built their reporting around a stable set of marketing metrics: organic traffic, search rankings, click-through rates, and ROAS. These became the dominant performance indicators not because they were perfect, but because they were easy to track and easy to report.
The logic made sense at the time. More organic traffic meant more potential customers. Higher rankings meant greater visibility. Click-through rate measured whether ads were relevant.
ROAS connected spend to revenue in a single ratio. These gave teams something concrete to optimize and executives something simple to evaluate.
The problem was that teams began equating activity with impact. A spike in sessions became evidence of a successful campaign. A high ROAS figure became justification for more spend.
But these metrics measured what happened on a screen, not what drove a purchase decision. Many of them are what marketers now call vanity metrics: numbers that look meaningful but don’t connect reliably to revenue.
Analytics dashboards were built to track what they could see, and teams made decisions based on what was visible. That created a structural bias toward channels that were easy to measure, even when harder-to-measure channels were doing more of the actual work.
Why Many Marketing Metrics Are Becoming Misleading
The way people discover brands has changed substantially, and many standard marketing KPIs were not built to account for that shift. Three changes in particular are making traditional metrics less reliable.
Zero-Click Discovery Is Increasing
AI-generated answers, featured snippets, and knowledge panels now resolve many queries without requiring a click. According to Pew Research, when users encounter an AI summary in search results, they click through to websites at roughly half the rate they do with standard results. Around 26 percent end their session after viewing an AI summary, compared to 16 percent for standard search results.
For marketing teams, this creates an invisible influence problem. A brand can shape a buyer’s thinking through AI-cited content without that interaction ever appearing in a traffic report. Organic search may be doing more work than the data suggests, and session counts alone cannot tell you which.
Discovery Happens Inside Platforms
Buyers increasingly research and evaluate brands inside closed ecosystems: social platforms, marketplaces, YouTube, and AI-driven interfaces. These platforms have their own algorithms, their own ad systems, and limited data sharing with external analytics tools.
According to NP Digital research, 82 percent of marketing engagement now happens through video, while SERP and AI answers account for 79 percent of engagement. Only 12 percent happens on-site. Website analytics captures a fraction of where influence actually occurs.
Brands get evaluated across Google, YouTube, LinkedIn, review sites, and AI engines, often before a customer ever visits a website. NP Digital data also shows that the average customer journey has grown from 8.5 touchpoints in 2021 to 11.1 touchpoints in 2025. What looks like a direct visit or a branded search conversion often reflects influence that originated somewhere else entirely.
Traffic No Longer Reflects Influence
Even when traffic increases, the quality of that traffic has become harder to assess. NP Digital research tracking 602 websites found that 51 percent of traffic came from bots and 21 percent were short sessions, leaving only 16 percent that could be classified as genuinely engaged sessions.
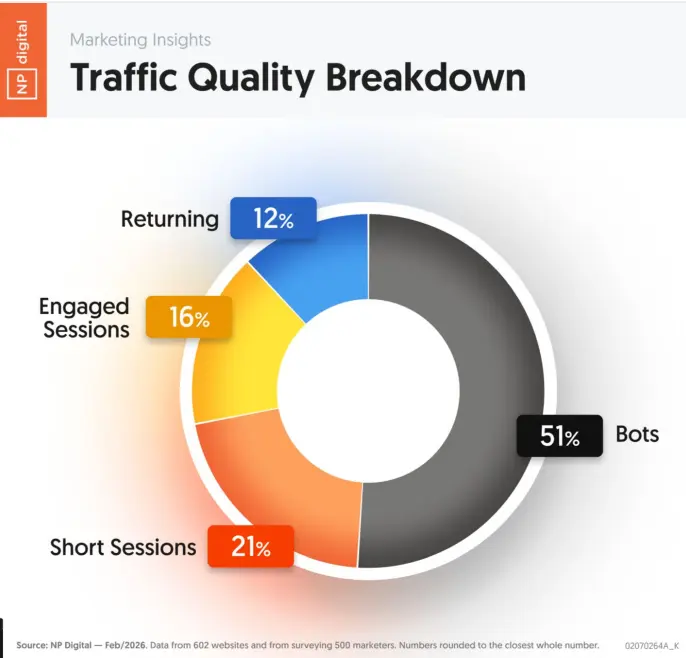
More sessions do not equal more intent. Traffic can grow while real engagement shrinks, particularly as bots, low-intent visits, and passive content consumption inflate session counts. Optimizing for traffic volume in this environment can mean more spend for fewer qualified outcomes.
The Attribution Problem Most Teams Ignore
Marketing attribution became central to reporting because it appeared to solve a hard problem: connecting activity to conversions. For direct-response channels with short feedback loops, it worked reasonably well. But attribution has a structural limitation that deserves more attention. For a deeper look at where these systems break down, see this overview of marketing attribution blind spots.
Attribution models credit the touchpoints that preceded a conversion. They track what happened well. They are not built to determine whether marketing caused the outcome.
That distinction matters more than it might seem. Algorithmic platforms optimize toward users who are already likely to convert.
Last-click models, and many of their more sophisticated variants, inherit this bias. They reward demand capture over demand creation, which means the channels that appear most efficient are often the ones intercepting customers who would have converted regardless.
The evidence from major advertisers is instructive. When Airbnb paused its performance marketing budget, there was no significant drop in bookings. When Uber reduced spend in certain channels, rider acquisition was largely unaffected. In both cases, attribution had been crediting spend for outcomes that would have occurred without it.
Privacy changes have made this harder to ignore. Third-party cookie deprecation, cross-device behavior, and private sharing channels all reduce the fidelity of attribution data. According to NP Digital research, nearly 47 percent of marketers lack confidence in their attribution model. Yet most teams still use attribution reports as the primary input for budget decisions. Data-driven attribution improves on last-click models in some respects, but it still cannot fully separate demand creation from demand capture.
Attribution remains useful for day-to-day campaign optimization. The problem is treating it as strategic truth, as proof that marketing caused growth.
Why ROAS Can Hide the Real Economics of Marketing
ROAS is the most widely used efficiency metric in paid marketing, and for good reason. It is simple, ties spend to revenue, and is easy to compare across campaigns and channels. The problem is that ROAS compresses a marginal return curve into a single number, and that compression hides where spending stops being productive.
Consider a channel running at an overall 4x ROAS. That number looks strong. But if the first $100,000 spent generated 8x returns and the last $200,000 generated 0.5x returns, the blended average conceals a significant amount of wasted spend. Optimizing toward the average means continuing to invest in the tail of a diminishing curve.
ROAS also ignores what created the demand being captured. Branded search conversions frequently get credited to paid search, but the intent behind that search often originated from a video campaign, a piece of organic content, or a recommendation that happened in a private channel. The channel capturing the intent gets the credit. The channel that generated it does not. This dynamic is especially relevant for ecommerce metrics, where brands often over-invest in bottom-funnel capture while underfunding the upper-funnel activity that makes conversion possible.
The question ROAS does not answer is: how much of this revenue was incremental?
Separating captured demand from created demand requires different tools, which is why leading organizations are increasingly pairing ROAS with incrementality testing and marketing mix modeling.
The Question Executives Actually Care About
The metrics most marketing teams optimize are not the ones most executives prioritize. According to NP Digital research, 92 percent of marketers say profit is a primary metric, and 87 percent prioritize pipeline. Search rankings rank near the bottom at 18 percent, and ROAS comes in at 16 percent.
That gap reflects a real tension. Marketing teams spend considerable time reporting on activity and efficiency. Leadership wants to know whether marketing is actually changing the economics of the business.
The core question executives ask is whether marketing caused growth, or whether it captured demand that already existed. These are different outcomes. A campaign can generate strong attribution numbers while producing no incremental growth. A brand investment can create lasting demand without generating a single directly trackable conversion.
The questions that matter most at the leadership level are:
Did this campaign create new demand, or intercept demand that already existed? Would revenue have changed if this marketing activity had not occurred? Which investments change the underlying economics of the business?
These are questions about causality, not efficiency. They cannot be answered by ROAS or click-through rates. They require measurement methods designed to isolate actual marketing impact from demand that would have existed regardless. This is the gap that is pushing high-growth organizations toward a different approach.
What Modern Marketing Leaders Measure Instead
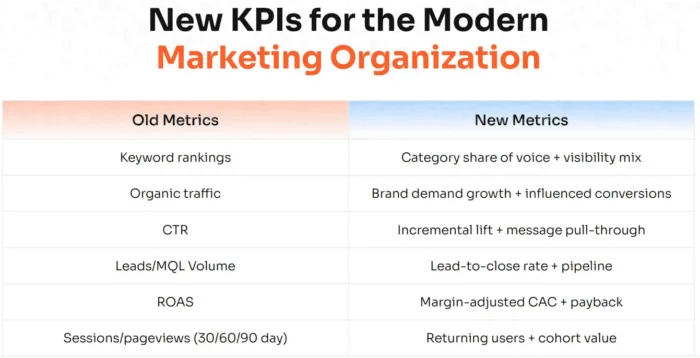
The most important marketing metrics for growth-focused organizations look different from the ones that dominate standard dashboards. The shift is away from activity-based signals and toward measures tied directly to business outcomes.
Rather than optimizing for total traffic, leading teams track branded demand growth, which captures whether the brand is generating more direct interest over time. Rather than reporting on attributed conversions, they measure incremental conversions: the outcomes that would not have happened without the marketing. Understanding the most important marketing metrics for your business means asking which numbers reflect whether marketing is creating demand, not just capturing it.
Customer value metrics have become more prominent as well. Lifetime value (LTV), customer acquisition cost (CAC) adjusted for margin, and payback periods give a more accurate picture of whether growth is sustainable. For teams managing ecommerce KPIs, this means looking past add-to-cart rates and conversion percentages toward cohort retention, repeat purchase rates, and revenue per customer over time.
Revenue per session, lead-to-close rates by channel, and downstream conversion quality provide a fuller picture of marketing performance than surface metrics can. A channel that generates high traffic but low-quality leads may look better on a standard dashboard than one generating fewer, higher-value conversions.
The shift does not mean abandoning familiar metrics entirely. Traffic, rankings, and ROAS still provide useful context. The change is in treating them as diagnostics rather than goals. The next piece in this series examines how high-growth organizations build the measurement systems that track these signals, combining marketing mix modeling, incrementality testing, and attribution into a layered approach that answers different questions at different levels of the business.
FAQs
What Are KPIs in Marketing?
Marketing key performance indicators (KPIs) are the metrics teams use to evaluate performance against business goals. Common marketing KPIs include traffic, leads, conversion rates, ROAS, and customer acquisition cost. The most useful KPIs are ones tied directly to business outcomes rather than activity alone.
What Are Marketing Metrics?
Marketing metrics are the data points used to evaluate marketing performance. These range from top-of-funnel measures like impressions and traffic to bottom-of-funnel measures like conversion rate and revenue. Not all marketing metrics examples reflect real business impact equally, which is why understanding which metrics to prioritize matters as much as tracking them.
How Do You Make a Marketing Report?
A strong marketing report connects activity data to business outcomes. Start by identifying the decisions the report needs to support, then select metrics that reflect progress toward those outcomes. Include both leading indicators, such as branded search volume and engaged session rates, and lagging indicators like revenue and customer acquisition cost.
Conclusion
Marketing measurement has not failed. The environment around it changed, and the metrics that once served as reliable proxies for growth have become less accurate as discovery, attribution, and buyer behavior grew more complex.
The organizations gaining ground are the ones questioning which metrics actually reflect growth, rather than which ones look best in a dashboard. That means looking past traffic and attribution toward signals tied to incremental outcomes, customer value, and causal impact.
This is the foundation the rest of this series builds on. The next installment covers how high-growth companies structure their measurement systems, combining multiple methods to get directional confidence across different levels of the business. If you want to start reviewing your current approach, this guide to website performance metrics is a useful starting point, as is this breakdown of which marketing KPIs are worth keeping and which may be leading your team in the wrong direction.